Weekly COT Report: Dollar Bulls Retreat
-
As of Tuesday 17th December:
-
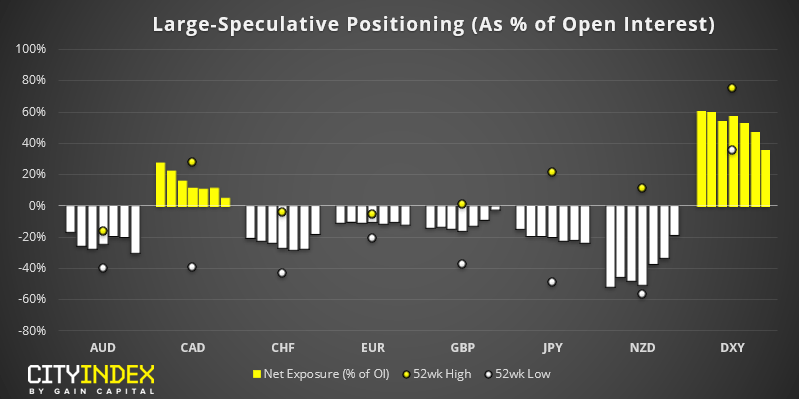
Large speculators were net-long USD by $14.5 billion, down by $3.6 billion the prior week
-
Bullish exposure fell to DXY its lowest level in 18-months
-
GBP traders were on the verge of flipping to net-long exposure, at just -5.8k contracts net-short
-
Traders were their least bearish on NZD in 8-months

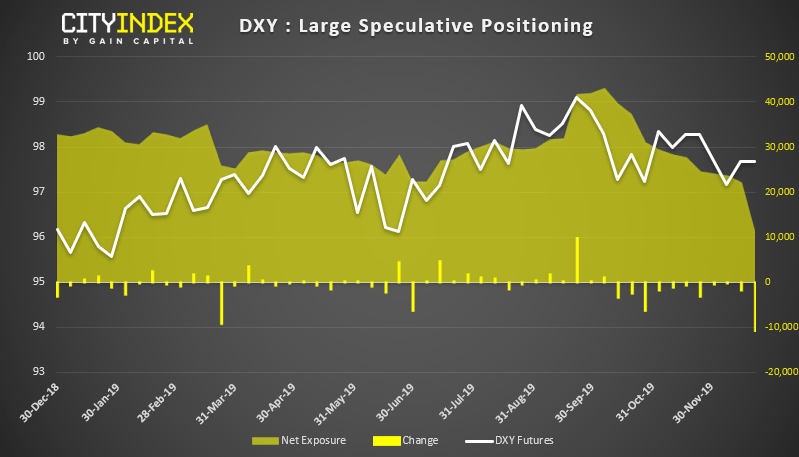
DXY: Bullish exposure fell to its lowest level in 18-months. Falling by -10.6k contracts, it was its largest weekly fall in 2.5 years. Gross longs are their lowest level since April 2018 and gross shorts have risen to a 3-month high. However, whilst this leaves room for further downside as we head into the new year, the monthly chart is on track for a bullish hammer which would be confirmed with a break above 98.38.
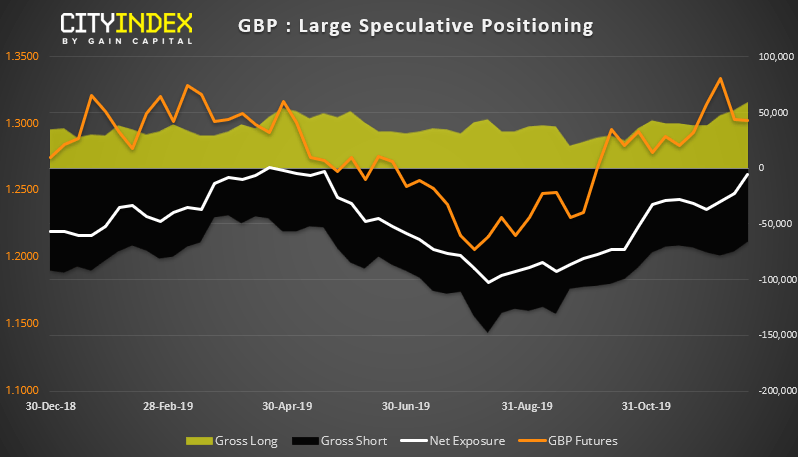
GBP: We were half expecting to see GBP traders flip to net-long exposure after Johnsons election victory. Yet with doubts still lingering over Brexit, it was not to be. And given GBP has retraced all of its election gains, its likely to remain net-short until we see a major breakthrough and confirmation that a hard Brexit will be avoided. For now, 1.30 appears to be a sticky level heading into 2020.
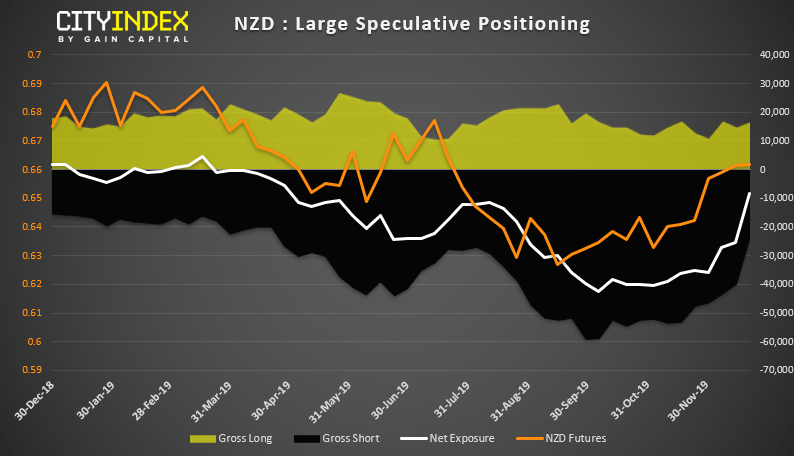
NZD: Bears have continued to capitulate, yet bulls remain cautiously on the side. We expect this to change as we head into 2020 as economic data overwhelmingly points towards a hold, and traders still don’t appear to be positioned for this outcome.
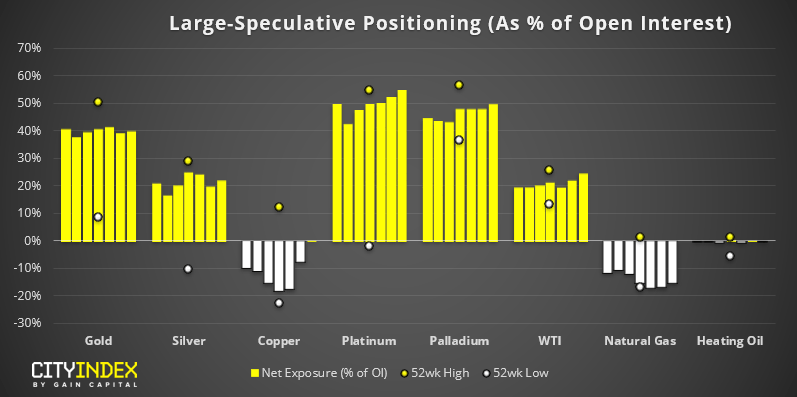
As of Tuesday 17th December:
-
Traders were their most bullish on WTI in 8 months
-
Large speculators flipped to net-long on copper
-
Net-long exposure on platinum was at its highest level since August 2016
-
Net-long exposure to gold remains defiantly long at +286.8k contracts, yet largely unchanged over the past few weeks
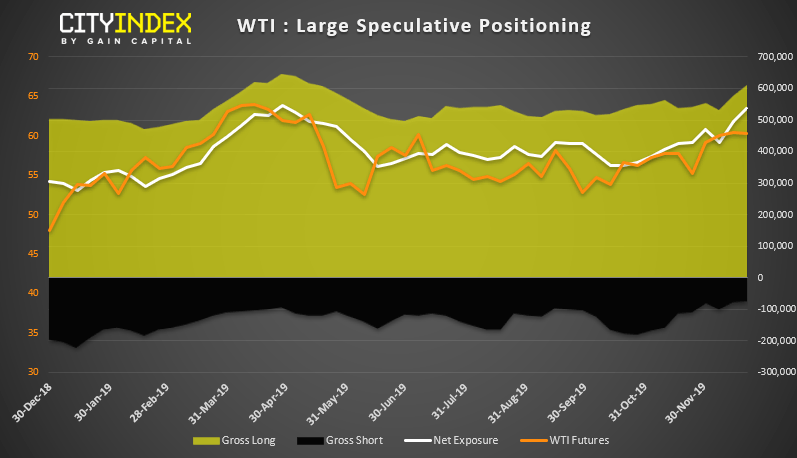
WTI: Oil is back above $60 and net-long exposure is at its highest level since April. Technically it remains within a bullish channel, although a two-bar reversal on Friday warns of a retracement from the highs. As we head into the new year, we remain bullish above 58.70 – 59.00.
Author

Matt Simpson, CFTe, MSTA
CityIndex
Matt Simpson is a certified technical analyst who combines charts and fundamentals to generate trading themes.


