Weak inflation numbers on Friday hurt CAD

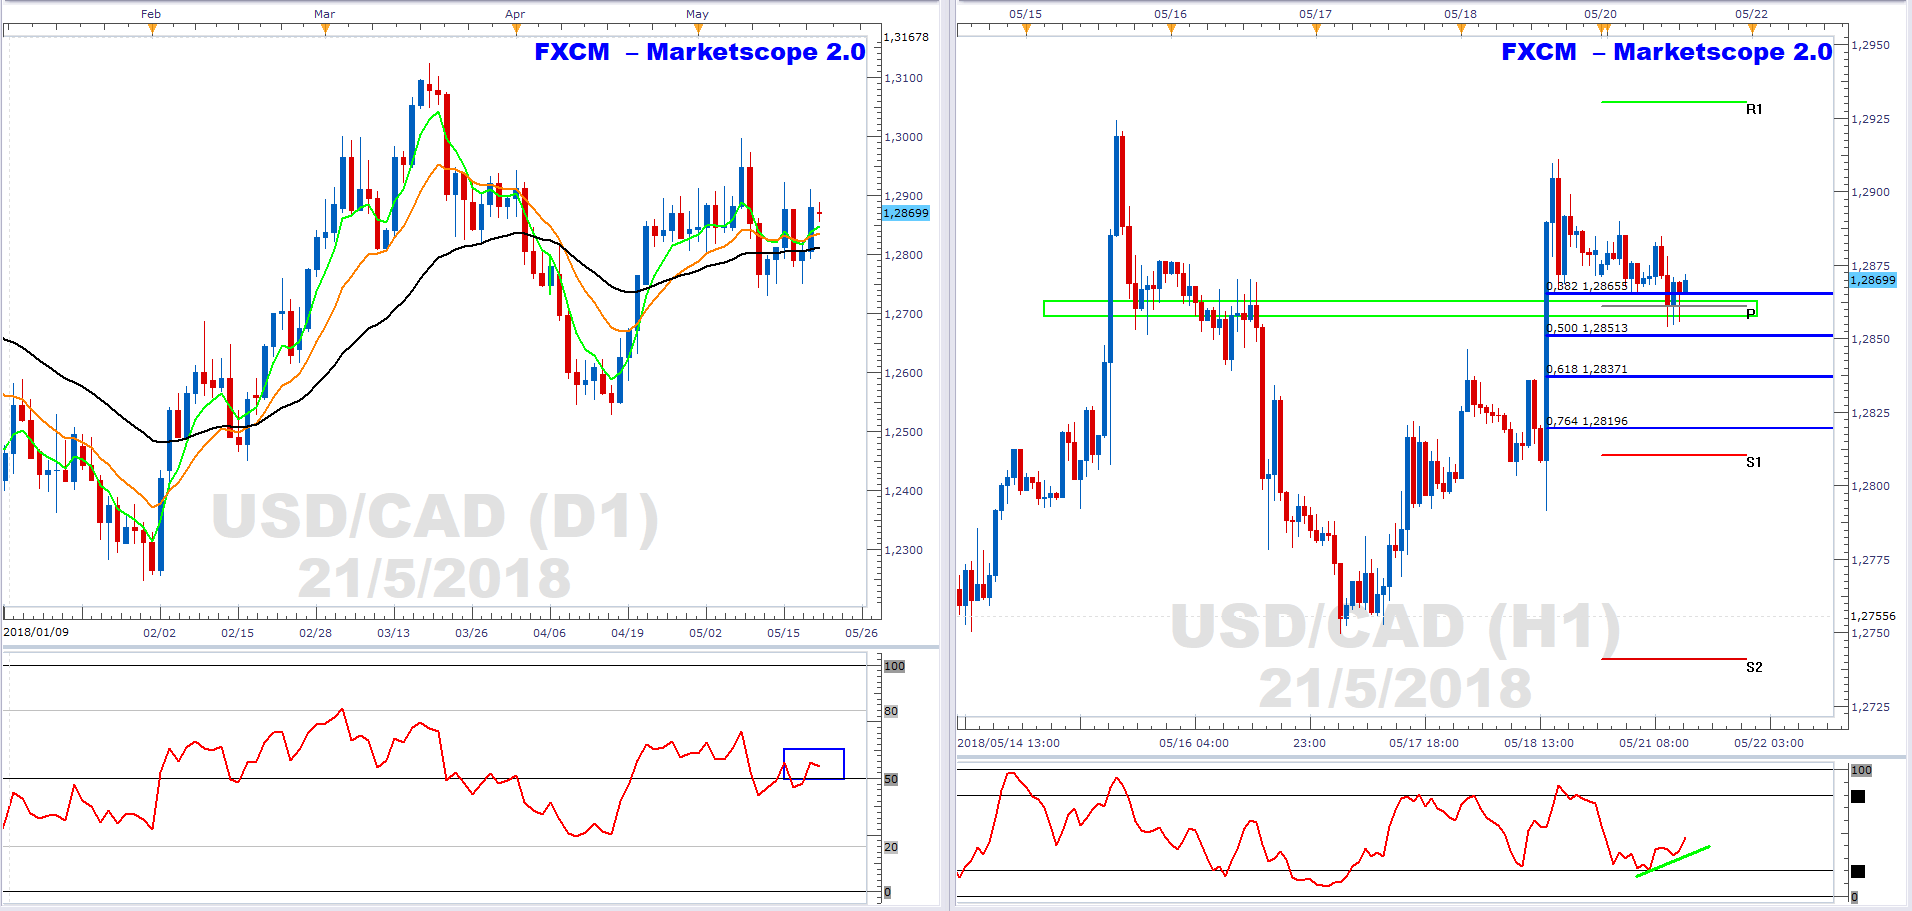
The USDCAD is in a mark-up phase. This phase is typically defined by a bullish EMA formation. I.e. the green 5-day EMA > the orange 13-day EMA > the black 34-day EMA. Moreover, the RSI(9) is above 50 and indicative of a bullish momentum.
Therefore, potential price support to be found with a confluence of factors including the central pivot support (P), the 38.2% Fibonacci retracement support and price support (green rectangle). There is also a bullish divergence in the stochastic (green trendline).
The loonie took a beating on Friday after inflation numbers showed inherent weakness. Yields on the Canadian 10-yr have been declining for today.
Author

Russell Shor (MSTA, CFTe, MFTA) has an Honours Degree in Economics from the University of South Africa and holds the coveted Certified Financial Technician and Master of Financial Technical Analysis qualifications from the Interna


