USDZAR: Is the South African Rand set for a reversal?

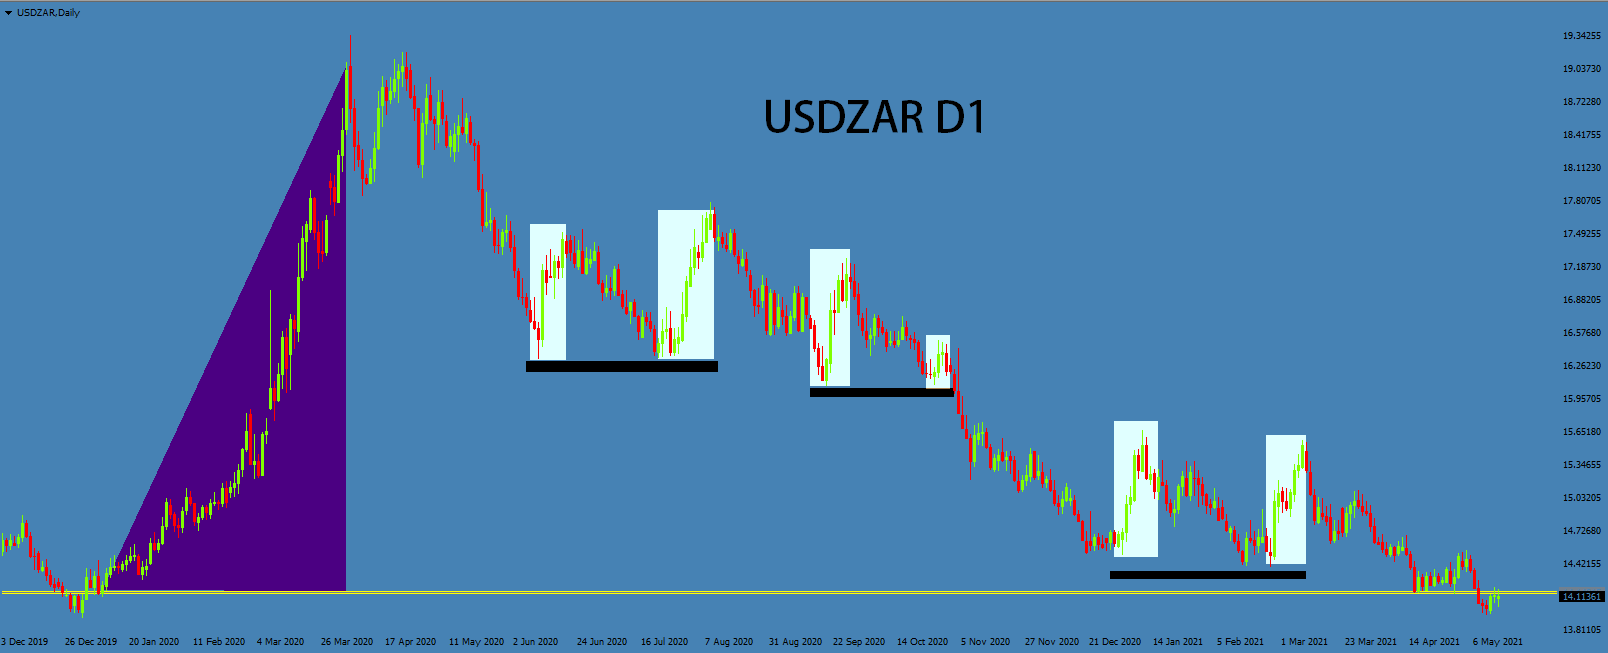
The USD radically strengthened against the ZAR between December 2019 and May 2020. On May 1, 2020, the USDZAR opened at 17.78 ZAR per USD. As of writing, the USDZAR is trading at 14.13.
The Rand has been chipping away at the USD's strength for the better part of a year. Now, one year later, the Rand is back to its pre-Covid position. Over this time, the USD would periodically stage a sustained comeback. However, it would eventually succumb to lower lows, as it failed to defend a third retesting of its support level. This pattern repeated several times from the perspective of the daily chart.
Where will a breakout go?
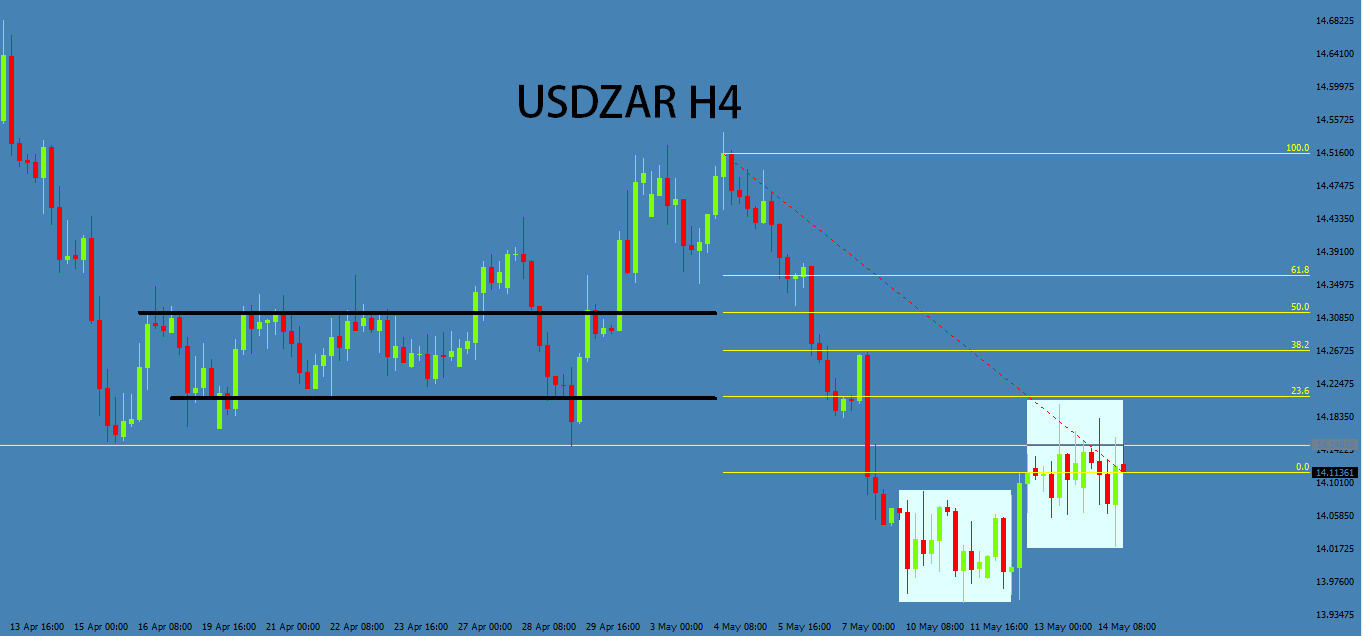
The USDZAR formed two distinct periods of consolidation during lasts weeks trading. The wicks on display at the H4 and H1 timeframes indicate that indecision in the market is rife at its current price range. I think a breakout is building for the middle of next week.
Keep an eye on South African Calendar Events this week
Two important South African calendar events are set for release on Wednesday, May 19. Those being the Inflation Rate YoY (April) and Retail Sales YoY (March).
Inflation for April is forecast to come in at 4.2%, which is one percentage point higher than last month. Analysts are reasonably accurate when forecasting South African Inflation, so no surprises are anticipated here. The expected Inflation value should already be priced into the market.
On the other hand, retail sales are expected to flip into positive territory for the first time since April 2020. Although, forecasting Retail Sales has been far more inaccurate in the recent past.
Favoring USD Bulls
I am leaning toward a breakout in favour of the USD. The US stock exchanges largely shook off inflation fears last week and rebounded after a big Wednesday dip. I am hoping people will take a more realistic view toward inflation moving forward. Therefore, I take a bullish view of the US and the USD in general.
Up for speculation is where the USD bulls take the pair. We have a couple of resistance zones that line up with a Fibo retracement. I like to look at these as possible zones for a USD rebound.
Will The Fed pull back on its spending?
The Fed has indicated that it is willing to tolerate some short-term inflation without changing direction in its monetary policy.
I would love to see The Fed indicate that it will follow the Canadian Centrals Bank's lead and begin to unwind its spending. With such an indication, the higher of the two resistance points is entirely within the realm of possibility in the short term.
Author

Mark O’Donnell
Blackbull Markets Limited
Mark O’Donnell is a Research Analyst with BlackBull Markets in Auckland, New Zealand.
















