USDX’s specific juncture maintains the bearish outlook

In the global financial world, with a highly interconnected economic dependence, commodities, energy, materials, and in particular, currencies play a pivotal role in the stock market’s heterogeneity and connectivity. This applies to gold as well as the world’s busiest precious metal marketplace.
Under normal conditions, gold and the US dollar are in an inverse relationship. Due to its worldwide denomination in USD, any USD weakness pushes gold prices up, and vice versa. Therefore, as far as the USD Index piece of the puzzle is concerned, the situation is not what it appears to be at initially, as we’ve witnessed something genuinely perplexing.
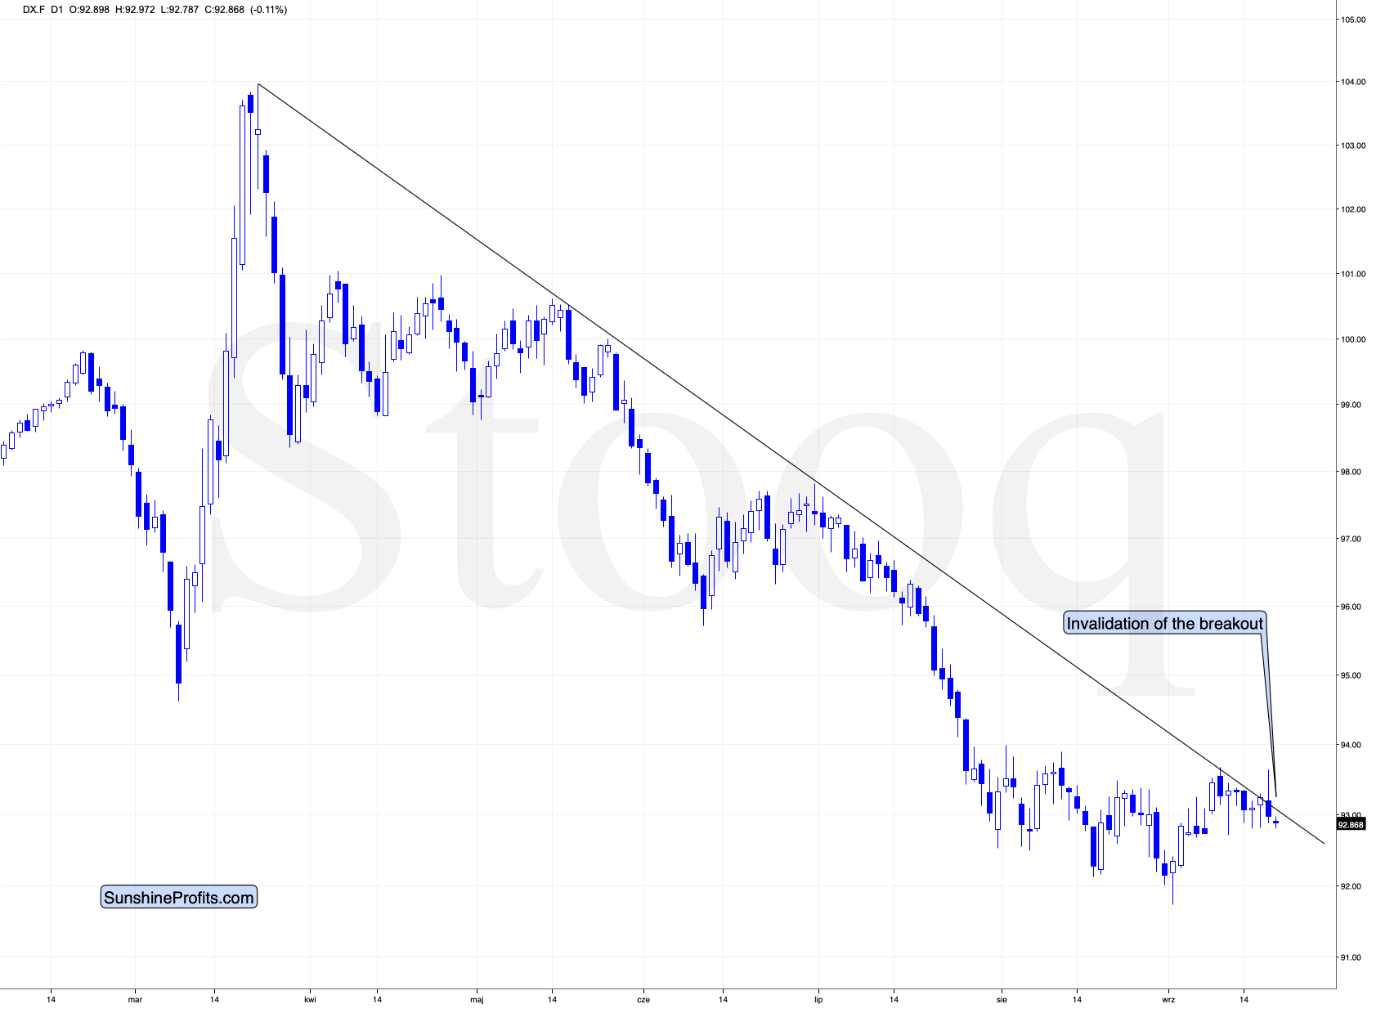
Namely, the index invalidated its breakout, which is a bearish sign. The USDX was quite visibly above the declining resistance line, but it failed to hold these gains. In July, a failure to rally above its resistance meant another significant downturn, causing higher gold prices.
So, does the USD Index and gold await the same faith soon?
Not necessarily.
The USD Index is a weighted average of several currency exchange rates. The biggest weight (over 50%) is attributed to the euro exchange rate, and the second biggest weight is attributed to the yen exchange rate. So, let’s see how the situation looks like in both currencies.
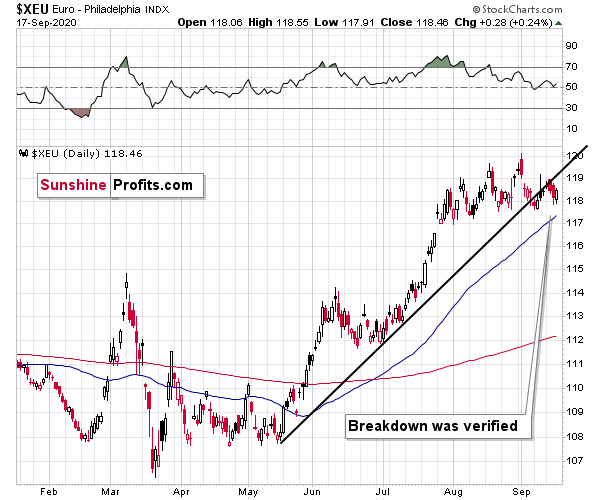
The euro is after a breakdown and a verification thereof. This is a very bearish situation, but bullish for the USD Index. Because of that, the situation with the euro is bearish for gold, at least in the short run.
And what about the Japanese yen?
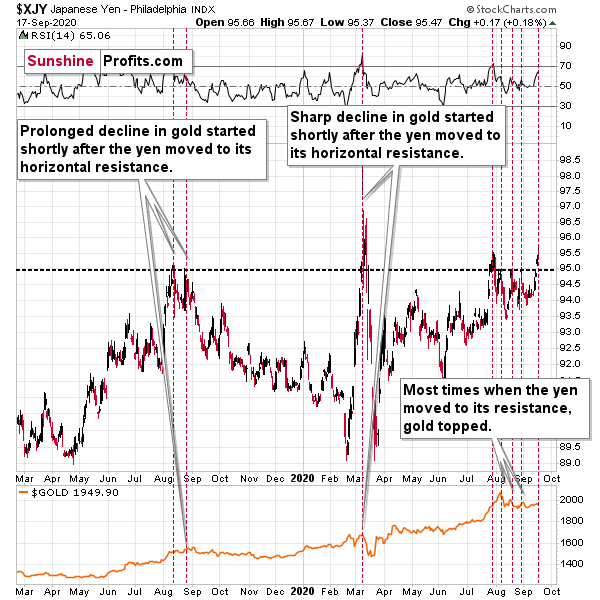
Well, the situation is not that different as far as the implications are concerned, but the direct reason for it is.
As you can see on the Japanese yen index chart above, in the past 1.5 years, whenever the yen tried to rally above the 95 levels, it topped briefly and reversed its course.
In the mid-2019, this resulted in a prolonged gold decline, and by early 2020, it resulted in a sharp and deeper decline.
In recent weeks, we’ve detected the signal above (the yen index trying to break above 95) 4 times: once it was just before the final top in gold, and in all the remaining (3) cases, these were local tops in gold.
The implications of the current yen situation are bearish for gold, and they are bullish for the USD Index, as the Japanese currency is likely to have invalidated the breakout once again. History tends to repeat itself, after all.
Given the tips that the individual currency exchange rates give us, should we really expect a USD Index’s breakout invalidation to lead towards lower values? Definitely not. The respective currency exchange rates are more “basic”, and their outlooks outweigh the index chart that is essentially based on them.
This means that the legitimacy of USDX's invalidation's bearish implications is suspicious, to put it mildly.
In other words, the bearish outlook for gold didn’t really change at all, even though we admit that it is not as bearish as it was before the USDX’s breakout’s invalidation. While we continue to predict lower gold prices, in the next several weeks (possibly months), based on the USDX action, we agree that the outlook is slightly less bearish than it was in the previous days.
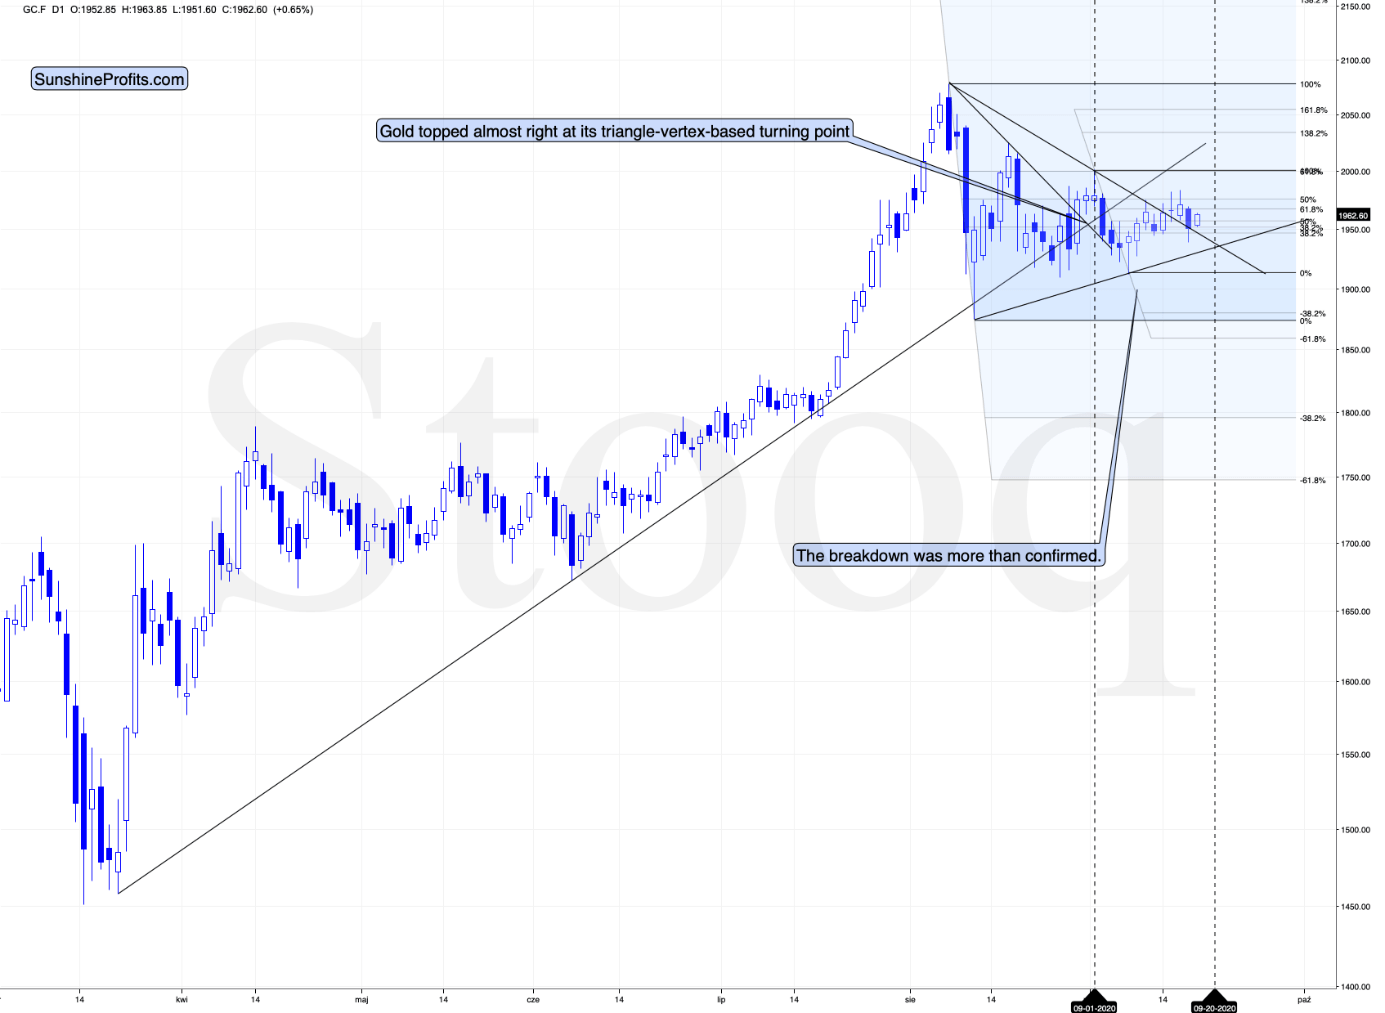
Please note that gold has yet another triangle-vertex-based reversal that is just a few days away. Perhaps the yellow metal will move slightly higher once again and then start its plunge on Tuesday or Wednesday. During this time, the USD Index could regain its strength and attempt to break above its declining resistance line once more. Only this time, the breakout would be successful.
All in all, the outlook for the precious metals market remains bearish.
Want free follow-ups to the above article and details not available to 99%+ investors? Sign up to our free newsletter today!
Want free follow-ups to the above article and details not available to 99%+ investors? Sign up to our free newsletter today!
Author

Przemyslaw Radomski, CFA
Gold Price Forecast
Przemyslaw Radomski, CFA (PR) is a precious metals investor and analyst who takes advantage of the emotionality on the markets, and invites you to do the same. His company, Sunshine Profits, publishes analytical software that any















