$USDX: The index structure showing an opportunity to buy commodities

The Dollar Index ($USDX) shows five waves since the low on 03.01.2008, which will provide many signals across the Marketplace. Below is a monthly chart of the Dollar Index
$USDX monthly Elliott Wave
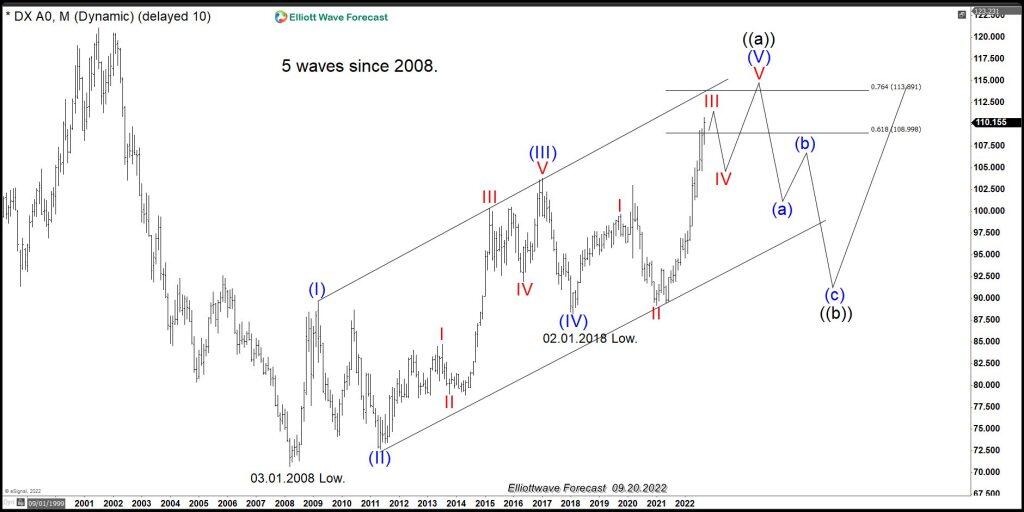
The monthly chart above shows the five waves advance from 3.1.2008 and the different degrees within the cycle. The idea is overall bullish for the USDX. However, there are two possibilities for the Dollar Index. It can make a significant correction soon and drop hard to correct the whole cycle. Alternatively, it will just correct the cycle since the lows at 02.01.2018 and continue higher.
We have found out at EWF that the most significant advantage of the Theory is the understanding of the sequence. Every time wave five appears, there is a clear right side and, consequently, opportunities. As we can see in the chart, since the lows at 03.01.2008, there are five swings in Blue. This gives a temporary warning for the $USDX buyers. It has also reached 61.8%-76.4% fiboancci extension between (I) and (II), which is usually an area where wave five can end. As we said, there are two outcomes. The first one is the classic pattern in the Elliott Wave Theory, which is presented in the following chart:
Elliott Wave impulse and zigzag cycle
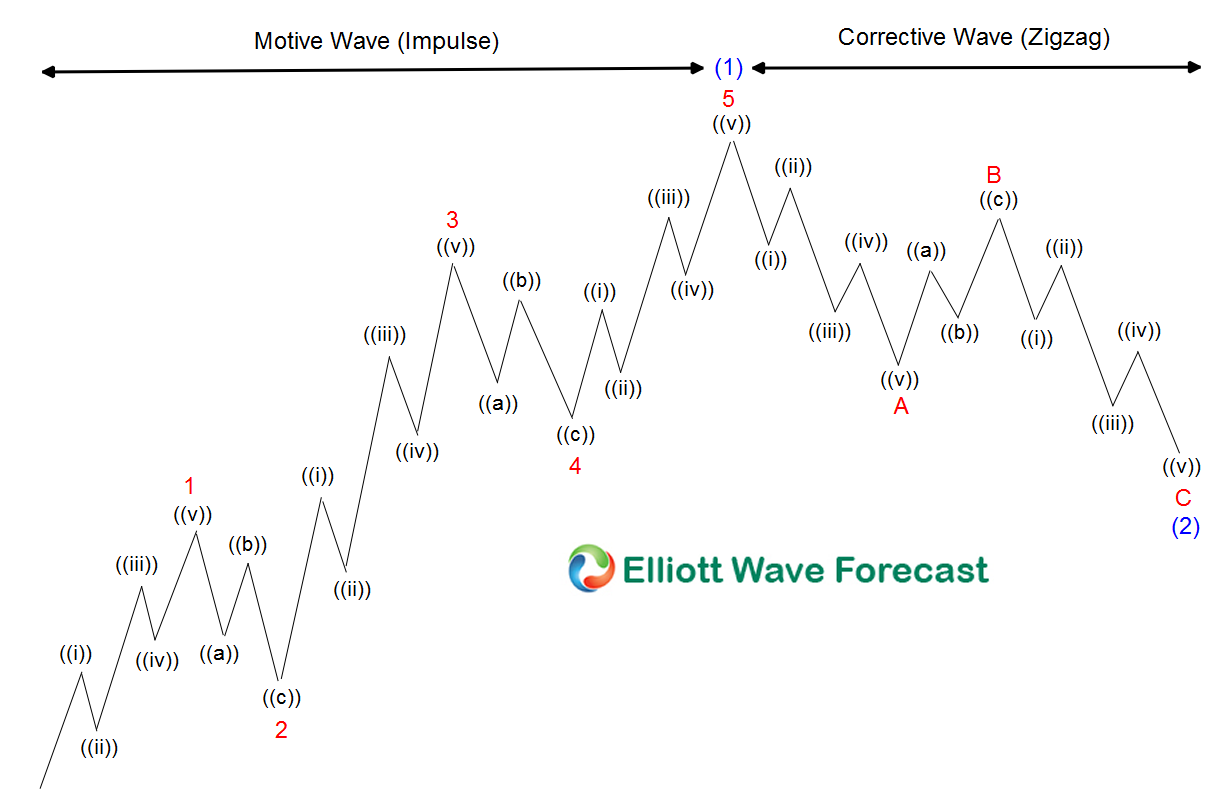
The above chart shows after five waves, a big sell-off of the Dollar can happen soon. If we downgrade the cycle since 02.01.2018 it looks to be missing wave IV and V. But this does take away the warning across the Market that Dollar can soon pullback.
The Second scenario is from the same lows at 03.01.2008, the Index is showing the same five waves. But in this case, we call them five swings, which is a huge difference. The following chart shows the structure:
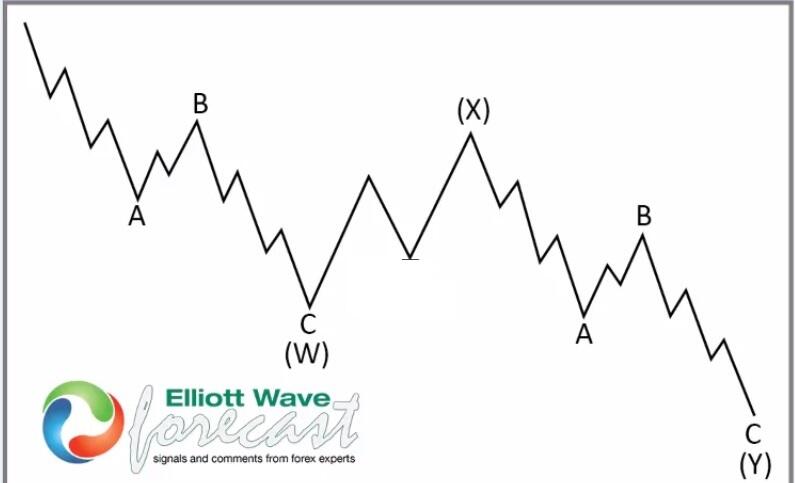
The above chart shows a WXY structure. It combines two cycles of three waves or two ABCs in the Elliott Wave Theory. In this second scenario, the Index should end swing five off the lows at 02.01.2018, but the pullback should be less than scenario one.
Professional traders understand the whole market and always look for the instrument showing clear structures. They then look for opportunities to buy/sell what we call Elliott Wave hedging, which is when both sides of the Market (i.e. buyers and sellers), agree on a reaction. Looking at the USDX structure and analyzing both scenarios, 2023 can see a pullback in the USDX. The Elliott Wave structure is however clear that the higher degree right side is bullish. The Index should be supported for a long time. Commodities lead the USDX pairs, trading in the second dimension when they agree in the swing direction but not the overall direction. It is evident in the following chart:
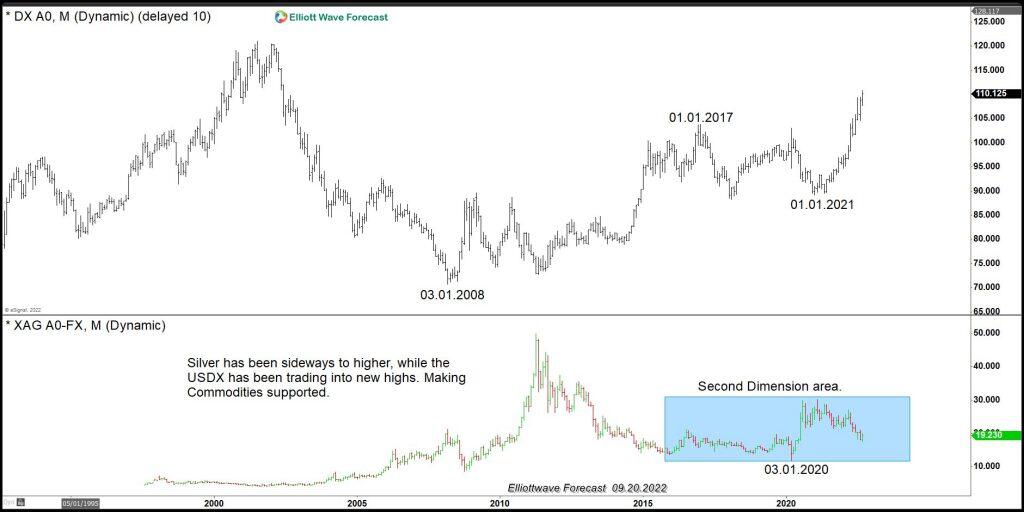
The $USDX Monthly charts overlay with $XAGUSD (Silver); as we can see, the metal should not be trading below zero and has been holding the lows, while the USDX is close to a peak. Understanding and reading the market makes a huge difference in being on the right side and knowing which instruments to trade.
In Conclusion: 2023 might provide a pullback in the USDX, which means higher $EURUSD, $AUDUSD, $NZDUSD, $GBPUSD, and higher commodities. Commodities should hold stronger against the $USDX, and provide a better buying into 2023.
Author

Elliott Wave Forecast Team
ElliottWave-Forecast.com


