USDSGD – Trading Below Well-Defined Resistance (Daily chart)

Price Action Context
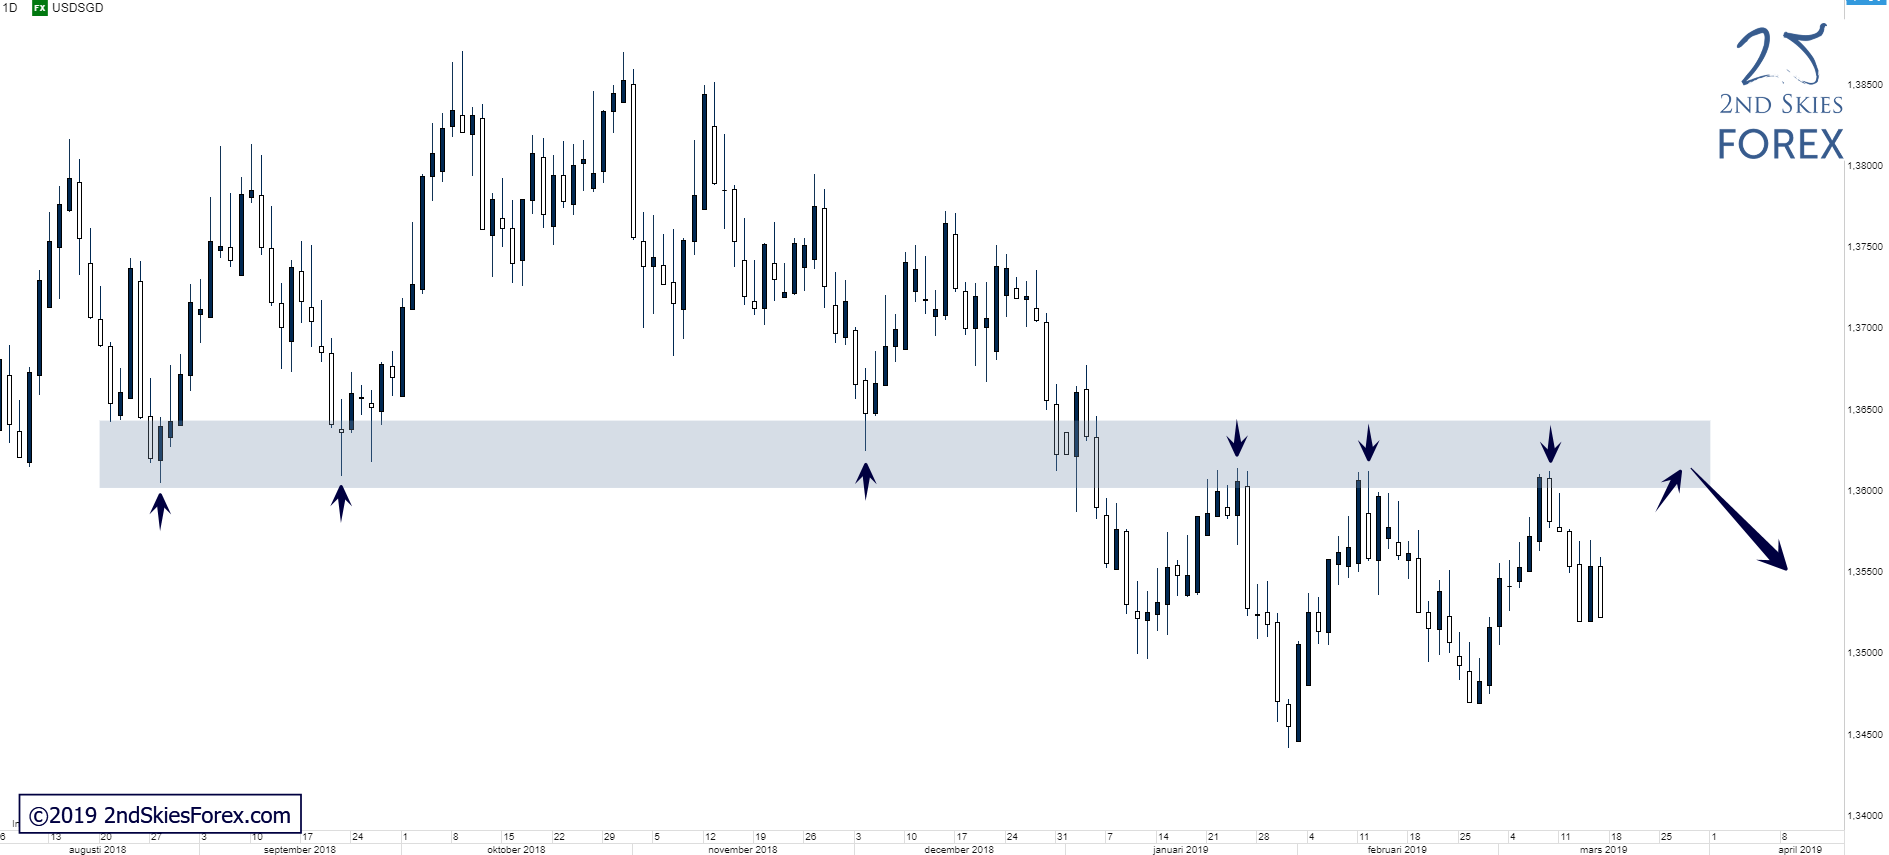
The pair traded within a with-trend corrective structure between July and October last year, but ending the year, price slowly started to roll over. In early January this year, bearish order flow increased and a key support was taken out by the impulsive move lower, which changed our LT bias to bearish. The broken support has since been tested as resistance 3 times and held cleanly every time.
Trending Analysis
LT Bias is bearish and bears can look for possible trading opportunities on pullbacks into the key resistance.
Key Support & Resistance Zones
R: 1.3600 – 1.3640
S: 1.3440 – 1.3470
Visit our website at 2ndSkies for more price action content, free trading lessons, strategies and videos. Find out how we can help you to change the way you think, trade and perform.
Author

Chris Capre
2ndskiesforex
Chris Capre is a professional forex trader and mentor specialized in Price Action trading, and the Ichimoku Cloud.


