USDJPY: The momentum indicators do not look healthy
US$Jpy had another bad day on Wednesday , breaking below the 2017 low, and falling to 106.70 in the US session, although most of the damage had been done earlier, in Asia.
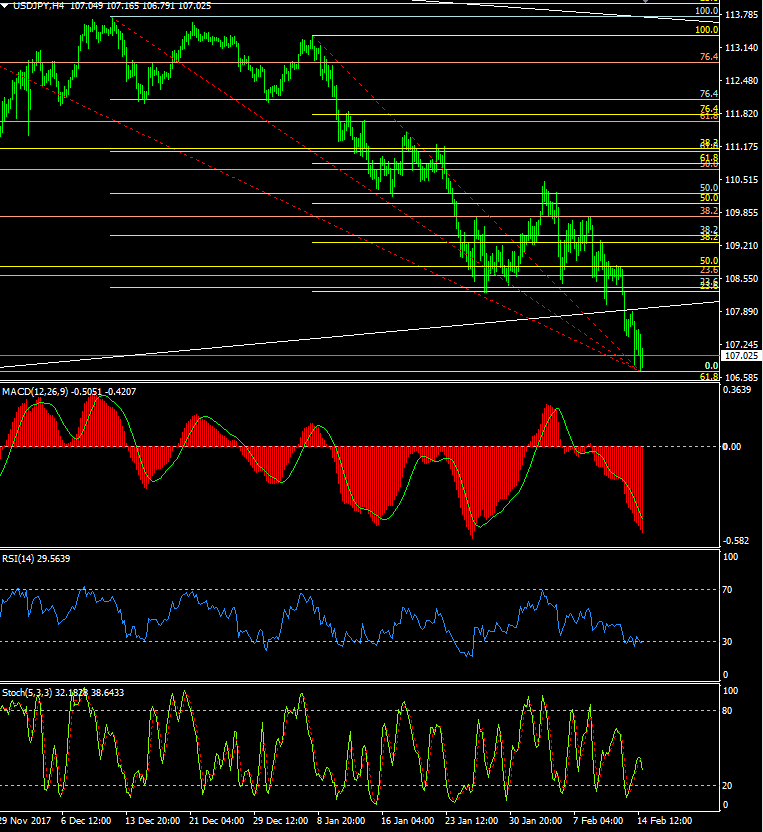
1 hour/4 hour indicators: Mixed. Turning lower?
Daily Indicators: Turning lower
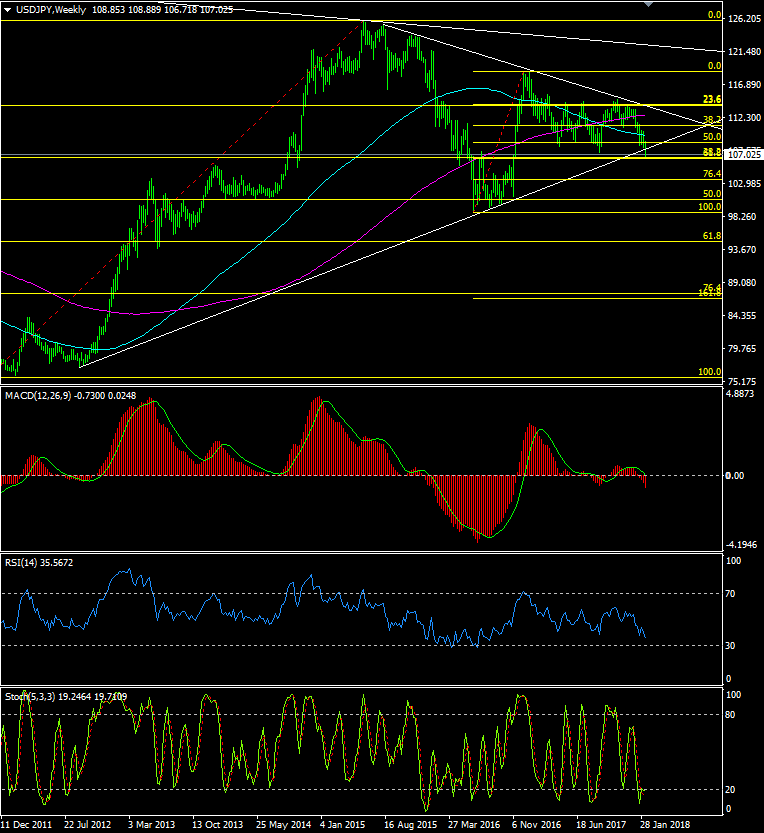
Weekly Indicators: Turning lower
Preferred Strategy: US$Jpy is currently holding on above the 106.71 session low although the momentum indicators do not look healthy and we could yet see a move towards the major Fibo target at 106.47, below which would then see little support until the 200 MMA at 105.70
On the topside, back above 107.32 (2017 low) is needed to calm the nerves, beyond which would find sellers at the previous trend support-turned- resistance, at around 107.65. Above there could see a squeeze to 108.00 and above.
Technically it looks as though the dollar is headed lower. Fundamentally, while stocks are rising and with several Fed hike looming, while the BOJ stand pat, I don’t see why the dollar should collapse. Too confusing for me.
Sidelined. Sell rallies?

Author

Jim Langlands
FX Charts
Jim Langlands began his trading career in the commodities markets in London in 1976, before moving to Australia in 1979 to work as a floor trader on the Sydney Futures Exchange.


