USD Trades in Consolidation with Bearish Bias

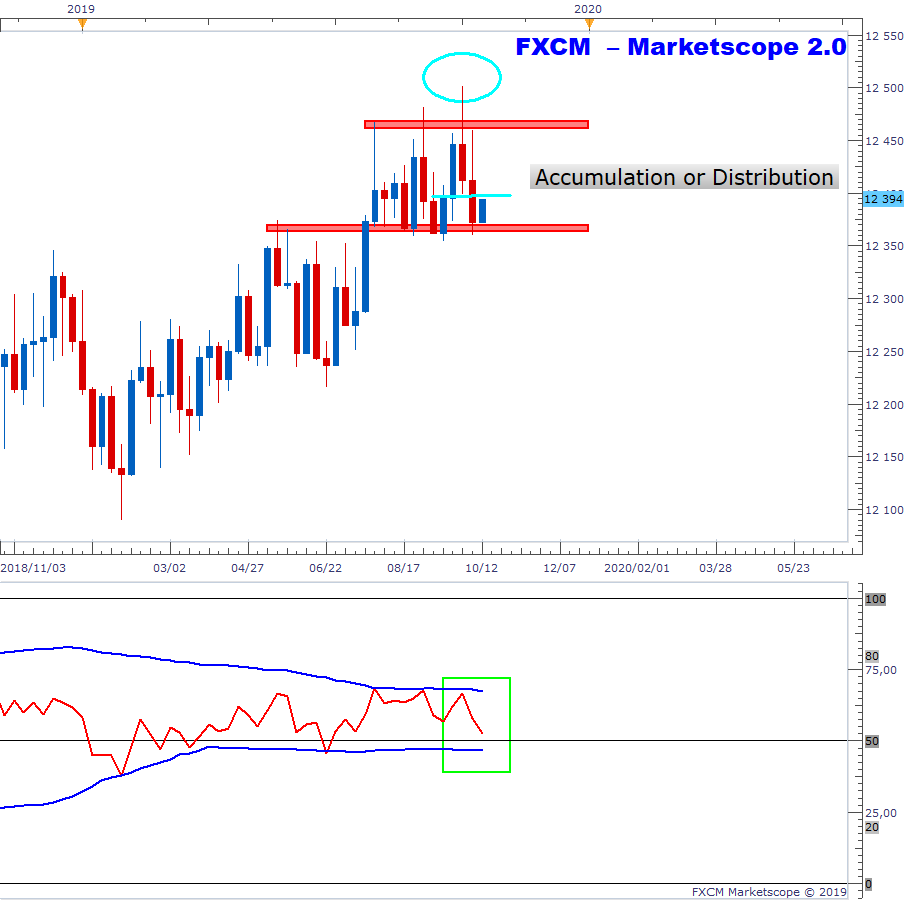
The below is the weekly chart of the US DOLLAR. The greenback continues to trade within a rectangle pattern (parallel red shaded horizontals) as the bulls and the bears battle it out for supremacy. The breakout direction will determine if it is an accumulation or a distribution pattern. Current price action has a distribution bias until proven otherwise. The candle from two weeks back is a bearish reference candle i.e. it has the highest high from a 3-candle pattern. Moreover, last weeks candle broke below and closed below the reference candle’s low (aqua horizontal) - bearish follow through. If price breaks below the lower rectangle boundary and the RSI drops below 50 this will give weight to the distribution scenario. We continue to monitor.
Past performance is not an indicator of future results.
CHART SOURCE: FXCM MARKETSCOPE 2.0
Author

Russell Shor (MSTA, CFTe, MFTA) has an Honours Degree in Economics from the University of South Africa and holds the coveted Certified Financial Technician and Master of Financial Technical Analysis qualifications from the Interna


