USD strengthened across the board despite weak US inflation

EURUSD
The euro closed lower on Wednesday, dropping to 1.1292(-37 pips) against the greenback. The pair has now retraced completely its weekly gains, as the Dollar strengthened across the board despite weaker-than-expected US inflation data. US reported consumer price index rose 0.1% in May, in line with expectations, while CPI grew 1.8% YoY below the 1.9% of consensus. Core CPI readings also came a touch softer than anticipated, scoring 0.1% MoM versus 0.2% expected, and 2.0% YoY versus 2.1% forecasted. However, data barely bothered the greenback, as a rate cut by the Fed seems mostly priced in by now. During the New York session, President Trump made his daily comment and threatened with imposing tariffs on China and Mexico if no deals are reached.
EURUSD 4 Hour Chart
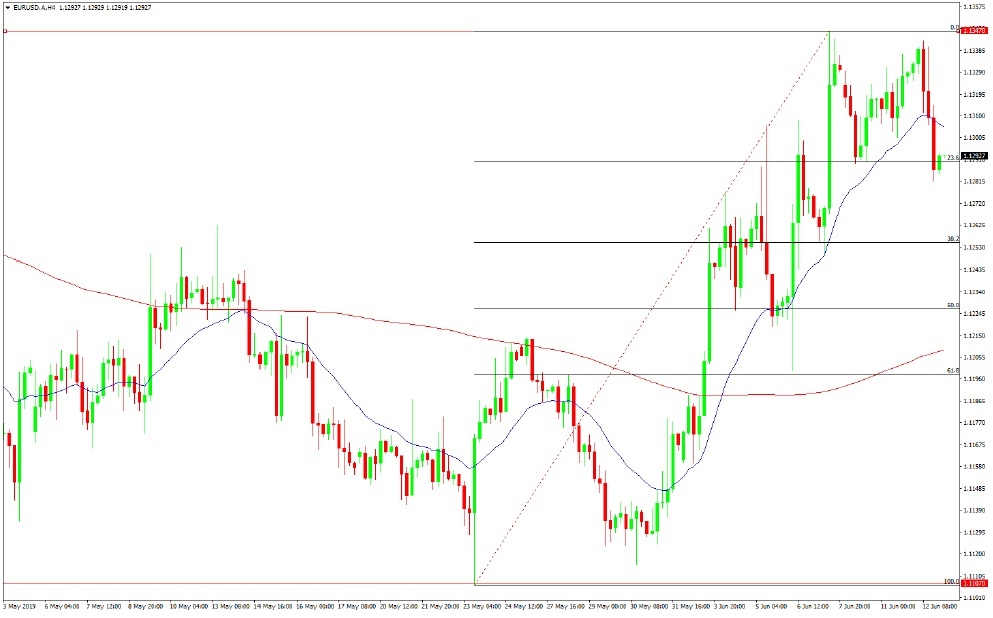
From a technical view, the pair made an upside attempt but was once again rejected from the top of its recent range, with today's peak at 1.1343. The pair broke below the 20-SMA(Blue Line) in 4-hour charts and slid below the 1.13 mark. The technical picture has turned negative in the short-term charts, with the Momentum and the RSI indicators both pointing south below their midlines, with the price below the 23.6% Fibo retracement of the 1.1107/1.1347 rally. The decline could easily extend to next Fibo level at 1.1255. However, in the daily charts, indicators are correcting from overbought conditions but remain positive, suggesting the pullback should be limited. On the upside, the pair needs a clear break above 1.1347 to test the 200-day SMA(Red Line) around 1.1365 first, en route to 1.1400.
GBPUSD
The cable pair was down on Wednesday, closing at 1.2692(-31 pips). GBP/USD pair moved sharply lower on Wednesday, amid a stronger Dollar and with the Pound facing renewed pressure from the defeat of the parliamentary vote designed to stop a hard Brexit. In an extremely close vote, MPs voted 298/309 on the Labour-led motion to prevent the UK leaving the EU without a deal. Labour leader Jeremy Corbyn said MPs needed to be told again about the "disastrous" impact of the UK leaving the EU without an agreement.
GBPUSD 4 Hour Chart

The pair fell to 1.2680, but the downside has been contained by the 100-SMA(Blue Line) in 4- hour charts while indicators are not giving clear signs, with Momentum and RSI flat and around their midlines. However, the overall perspective remains slightly negative according to daily charts. If GBP/USD breaks below 1.2650, then the pressure would mount, sending the pair quickly to test the 1.2560 zone. On the contrary, a break above 1.2820 could ease immediate pressure and refocus the pair to 1.2900.
Author

Capital Group Team
Capital Group


