Technical analysis: Will the growth of USD/MXN quotes continue?
USD/MXN technical analysis summary
Buy Stop։ Above 20,5.
Stop Loss: Below 19,4.
| Indicator | Signal |
| RSI | Neutral |
| MACD | Buy |
| MA(200) | Buy |
| Fractals | Neutral |
| Parabolic SAR | Buy |
| Bollinger Bands | Buy |
USD/MXN chart analysis
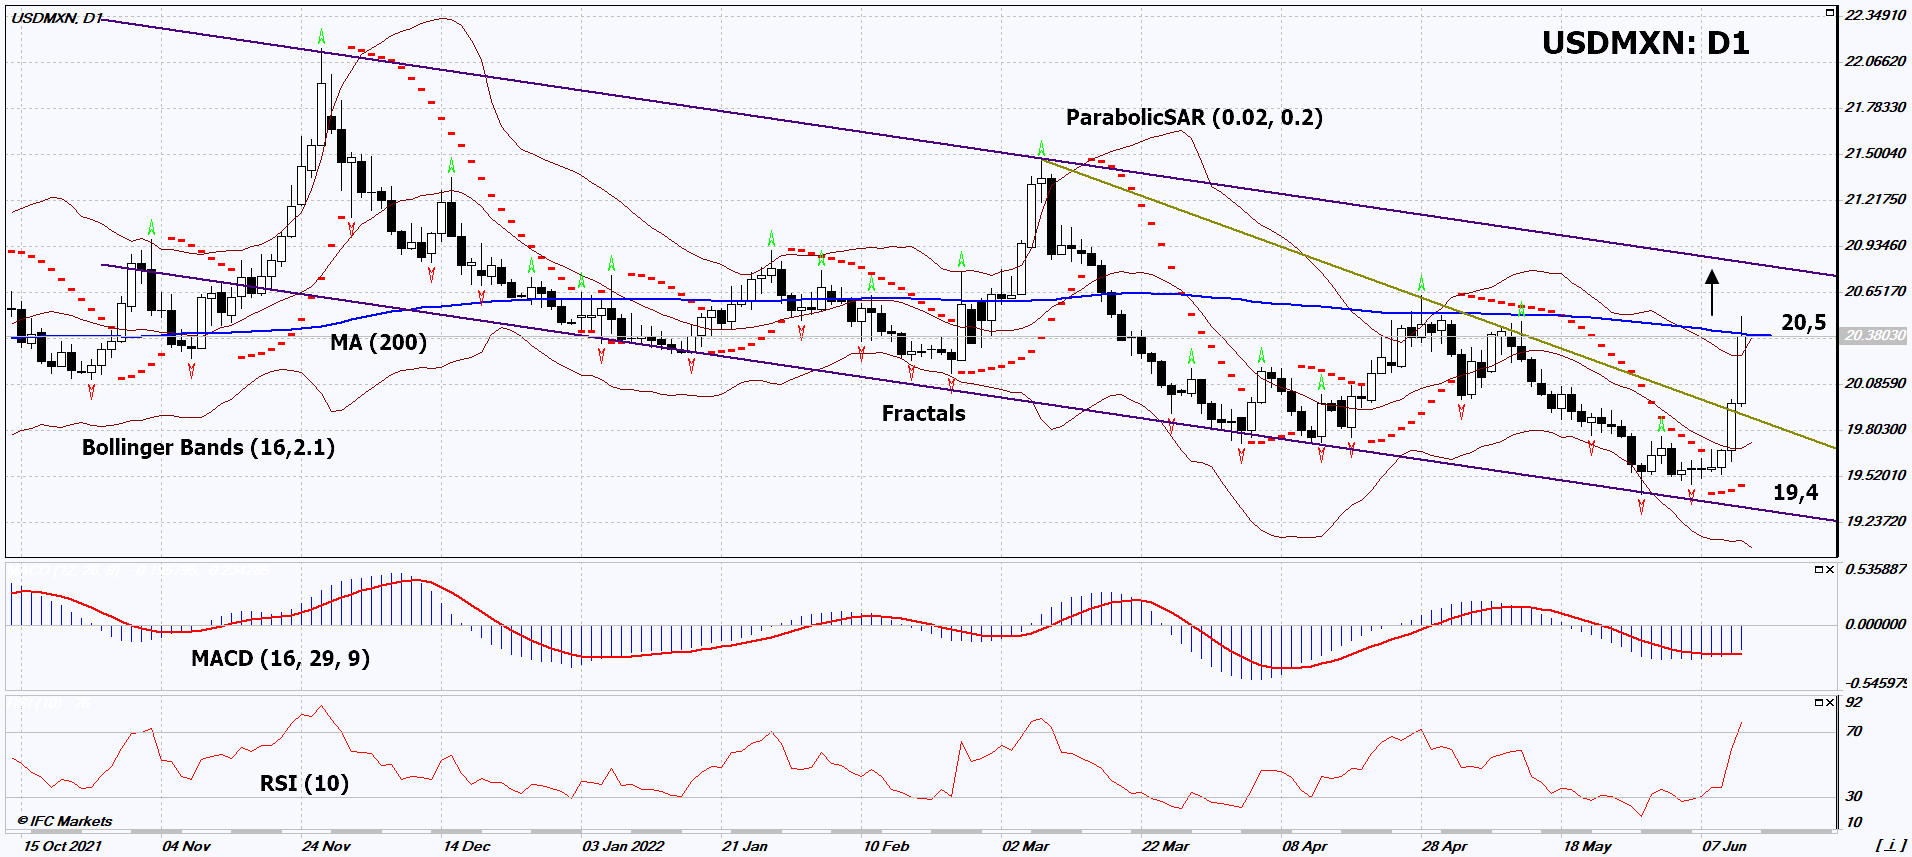
On the daily timeframe, USDMXN: D1 has exceeded the triangle resistance line and is moving towards the upper border of the descending channel. A number of technical analysis indicators formed signals for further growth. We do not rule out a bullish movement if USDMXN rises above its latest high, 200-day moving average and upper Bollinger band: 20.5. This level can be used as an entry point. The initial risk limit is possible below the Parabolic signal and the last 2 lower fractals: 19.4. After opening a pending order, we move the stop following the Bollinger and Parabolic signals to the next fractal low. Thus, we change the potential profit/loss ratio in our favor. The most cautious traders after making a trade can switch to a four-hour chart and set a stop loss, moving it in the direction of movement. If the price overcomes the stop level (19.4) without activating the order (20.5), it is recommended to delete the order: there are internal changes in the market that were not taken into account.
Fundamental analysis of forex - USD/MXN
Economic statistics increase the likelihood of a rate hike in the United States and reduce it in Mexico. Will the growth of USDMXN quotes continue?
Inflation in Mexico fell to 7.65% y/y in May from 7.68% in April. This is noticeably better than the forecast +8.2% y/y. Previously, the Bank of Mexico rate was raised 8 times in a row and now stands at 7%. The slowdown in consumer price growth reduces the likelihood of further rate hikes at the June 23 meeting. This week in Mexico is not expected to publish significant economic data. U.S. meeting The Federal Reserve will take place on June 15th. Market participants expect to increase the rate to 1.5% from 1%. Moreover, some investors do not exclude its growth up to 1.75%. The main reason for this could be high inflation in the US. In May, it reached a 40-year high of 8.6% per annum. Against this background, the yield of the US 10-Year Bond reached a maximum since April 2011 and amounted to 3.35% per annum. This contributes to a noticeable strengthening of the US dollar.
Want to get more free analytics? Open Demo Account now to get daily news and analytical materials.
Want to get more free analytics? Open Demo Account now to get daily news and analytical materials.
Author

Dmitry Lukashov
IFC Markets
Dimtry Lukashov is the senior analyst of IFC Markets. He started his professional career in the financial market as a trader interested in stocks and obligations.


