USD/JPY slides more than 700 pips following bearish wave analysis

USDJPY delivered a textbook Elliott Wave setup, plunging over 700 pips in a powerful downward expansion after completing its corrective recovery structure.
Identifying the turning point at 160.00 – 161.00
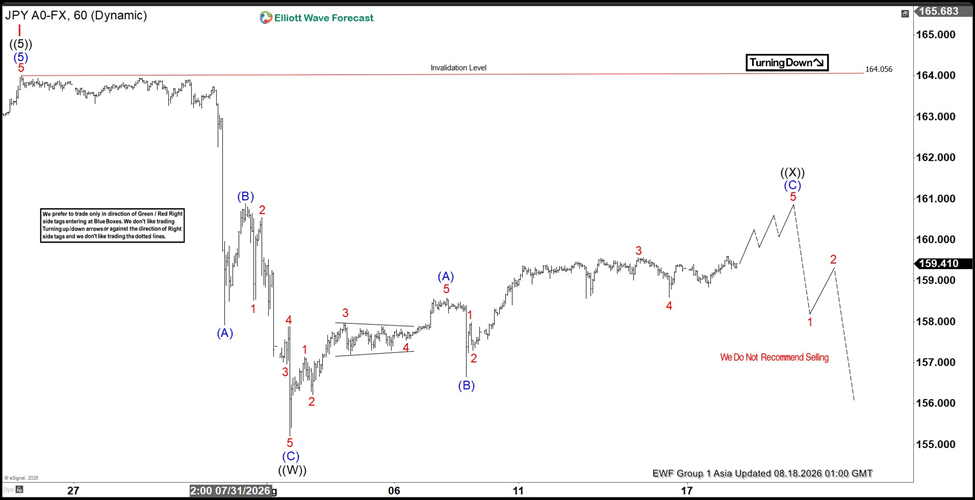
The chart from 08.18.2026 shows USDJPY completing a three‑wave corrective bounce, labelled wave ((X)), near the 161.00 handle. This counter‑trend recovery from the late‑July low unfolded as a clean (A)‑(B)‑(C) zigzag in ((W)). With the broader sequence favouring the downside, the 164.056 peak stood as the key invalidation level. The structural framework signalled a decisive ‘Turning Down’ move, projecting an aggressive bearish resumption once wave ((X)) concluded against that invalidation point.
The impulsive drop: Five waves down to 152.50
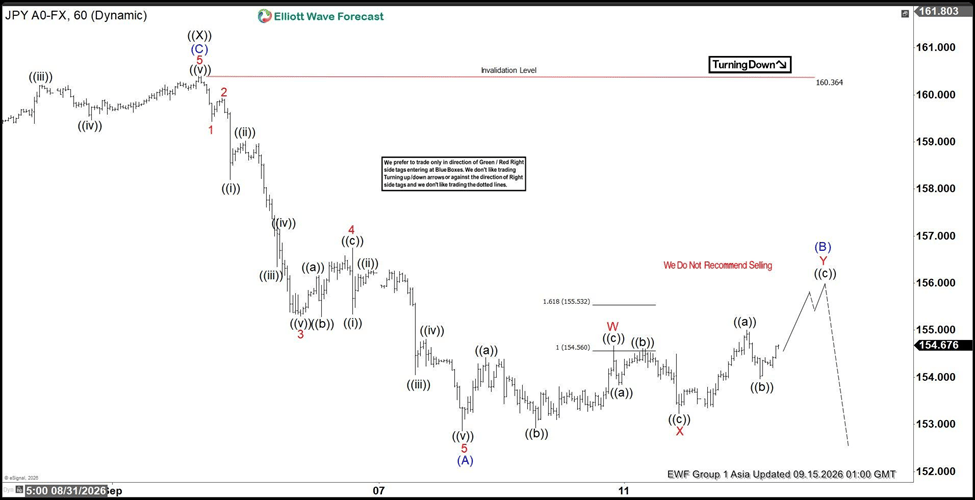
The subsequent price action confirmed the forecast with remarkable accuracy. As highlighted in the 09.15.2026 chart, USDJPY broke lower from the 160.364 peak, initiating a powerful five‑wave impulse sequence labelled wave (A). The decline cut through multiple support levels as sub‑waves 1 through 5 extended downward. Wave 3 drove the core of the sell‑off, followed by a brief wave 4 pause near 157.00, before wave 5 completed wave (A) around the 152.50 level.
Author

Elliott Wave Forecast Team
ElliottWave-Forecast.com