USD/JPY Forecast: Pullback to be short lived, eyes 115.00

The near 90-degree rally in the USD/JPY from the low of 107.32 came to a screeching halt in the Asian session after news hit the wires that North Korea is considering a nuclear test in the Pacific Ocean of an unprecedented scale.
Yonhap news cited North Korean Foreign Minister as a source for their news that a nuclear test might be North Korea's response to fresh sanctions imposed by the US.
The resulting risk aversion pushed the Japanese Yen higher across the board. USD/JPY dropped to a low of 111.65 before trimming gains to trade just above the 112.00 handle.
Treasury yields drop, yield curve flattens
Currently, the 10-year yield is down 2.1 basis points [bps]. The 2-year yield is trading flatlined. The yield curve has flattened, which is somewhat negative for the US dollar.
However, the focus is back on the interest rate differential, given that the Fed hinted at one more rate hike in Dec and three rate hikes in 2018. Consequently, a flatter yield curve could be good news for the USD.
Open positions in the JPY/USD Call options spike
| Call Summary | |||||
| Total | ITM | OTM | |||
| OI | Chg | OI | Chg | OI | Chg |
| 23,596 | 1,092 | 928 | -3 | 22,668 | 1,095 |
| Put Summary | |||||
| Total | ITM | OTM | |||
| OI | Chg | OI | Chg | OI | Chg |
| 27,841 | -660 | 19,884 | -200 | 7,957 | -460 |
The preliminary JPY/USD Oct expiry options data published by the CME shows the open positions in the Call options increased by 1092 contracts. Open positions in the money Calls dropped by 3 contracts, while the open positions in out of the money Calls jumped by 1092 contracts.
Clearly, investors are buying cheap insurance against the long USD/JPY spot. The fact that open positions in the JPY/USD Puts dropped by 660 contracts suggests the investors believe the rally in the USD/JPY spot is overdone and poised for a pullback.
Technicals
Daily chart
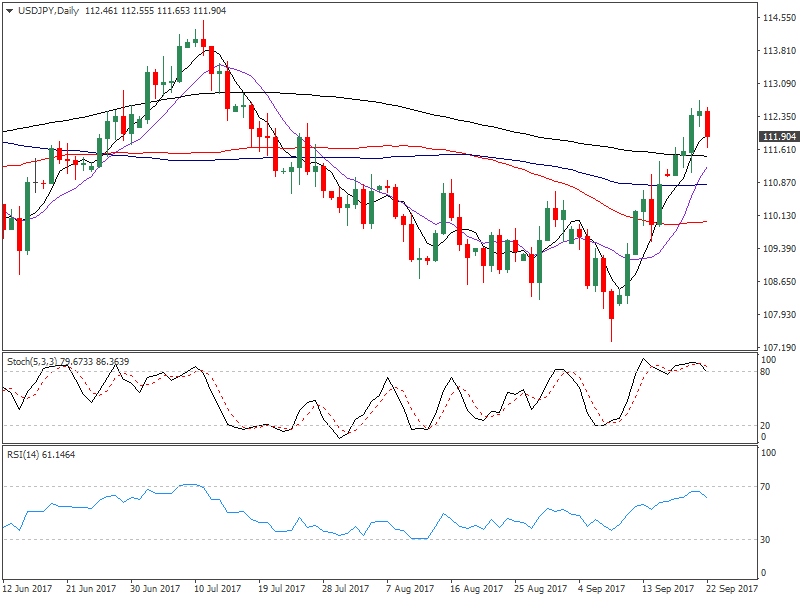
Observations
- Topping pattern - Rounding top and a bearish follow-through today
- Overbought Stochastic
- 14-day RSI is bullish but is no longer going upwards
- 5-DMA and 10-DMA are sloping downwards
Monthly chart - Basing formation around 108.00
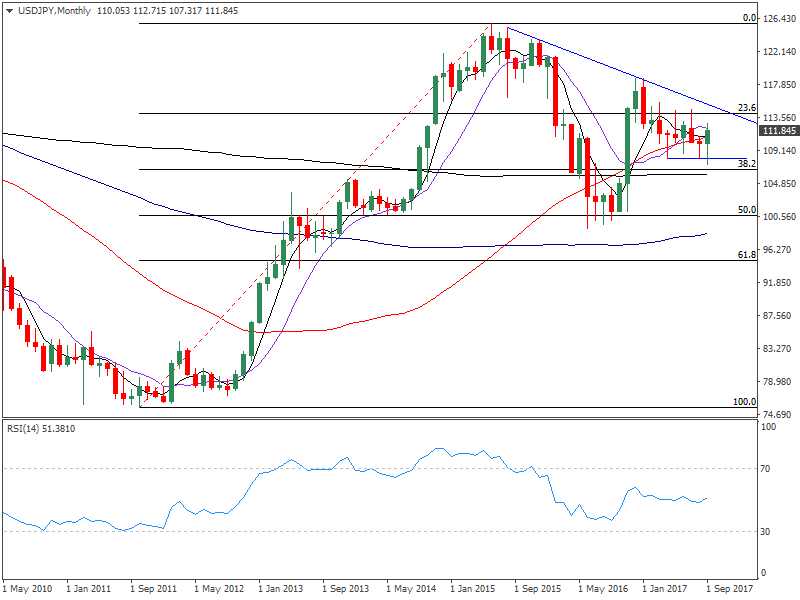
- Bears have repeatedly failed to push the spot below 108.00 levels since April.
- The basing formation around 108.00 followed by a solid rebound to a high of 112.71 this month is also accompanied by a basing formation on the RSI around the neutral level of 50.00
View
- Dips to 10-DMA or below are likely to be short-lived... The 10-DMA currently stands at 111.23 and is sloping upwards.
- The spot looks set to test 115.00 levels over the next few weeks.
- Only an end of the day close below 108.00 would revive the bearish view.
Author

Omkar Godbole
FXStreet Contributor
Omkar Godbole, editor and analyst, joined FXStreet after four years as a research analyst at several Indian brokerage companies.


