USD/JPY Forecast: Downside exposed as 10-year treasury yield hits 13-month low

The USD/JPY is looking south as the 10-year treasury yield is fast losing altitude.
The currency pair created a classic doji candle yesterday, implying indecision in the marketplace despite the truce in the trade dispute between the US and China and the resulting risk-on action in the global equity markets.
The US was set to raise tariffs on $200 billion in Chinese goods on Jan. 1. President Trump, however, agreed to hold off that tariff hike for 90 days during the dinner diplomacy with China's President Xi Jinping conducted over the weekend. In return, China has agreed to buy "a substantial amount" of US goods.
The agreement, which will take effect from Jan. 1, has bought time for the two countries to negotiate a permanent accord.
The trade agreement put a bid under the risky assets. The S&P 500 futures rose 1.5 percent in the Asian session yesterday and the US dollar took a beating, particularly against the commodity dollars. The dollar sell-off, however, ran out of steam in early Europe, indicating the trade truce was expected and more or less priced-in
Having recovered quickly from the lows below 113.40, the USD/JPY looked set to cheer the risk-on in equities. The gains, however, were capped at 113.82, as the US equities failed to extend gains seen early Asia.
Further, the 10-year treasury yield fell 8 basis points to 2.96 percent despite the better-than-expected US November ISM manufacturing data. That likely pushed the USD/JPY back to square one (opening rate of 113.65).
Notably, the 10-year fell to its 200-day moving average (MA) for the first time since November 2017, bolstering the already bearish technical setup, as seen in the chart below. Therefore, for the USD/JPY pair, the path of least resistance is to the downside.
US 10-year treasury yield
-636794839719901346.png)
The benchmark yield looks set to test 2.85 percent, having witnessed a double top breakdown last week. Therefore, the dollar will likely remain under pressure in the near future.
USD/JPY daily chart: today's close pivotal
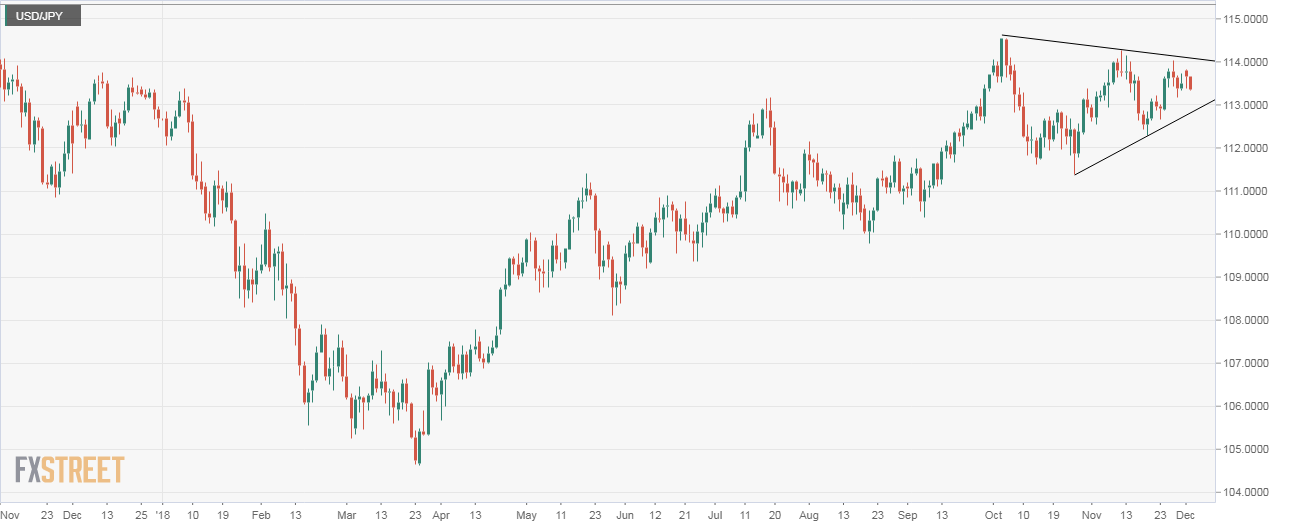
As seen above, the pair is trapped in a narrowing price range or a symmetrical triangle pattern. Yesterday Doji candle indicates the rally from the Nov. 20 low of 112.30 has likely run out of steam at a high of 113.84 hit on Nov. 27.
A bearish reversal, however, would be confirmed if the pair closes today below 113.37 (low of yesterday's doji candle). That would open up downside toward the triangle support, currently seen at 112.57.
As noted earlier, the US 10-year yield is looking south, as a result, the pair is more likely to take out the key support of 113.37.
A symmetrical triangle breakout, if confirmed, would signal a resumption of the rally from the March low of 104.63 and would allow a sustained move above 115.00.
Author

Omkar Godbole
FXStreet Contributor
Omkar Godbole, editor and analyst, joined FXStreet after four years as a research analyst at several Indian brokerage companies.


