USD/JPY Elliott Wave impulsive structure remains in play [Video]
![USD/JPY Elliott Wave impulsive structure remains in play [Video]](https://editorial.fxstreet.com/images/Markets/Currencies/Majors/USDJPY/japanese-yens-7972406_XtraLarge.jpg)
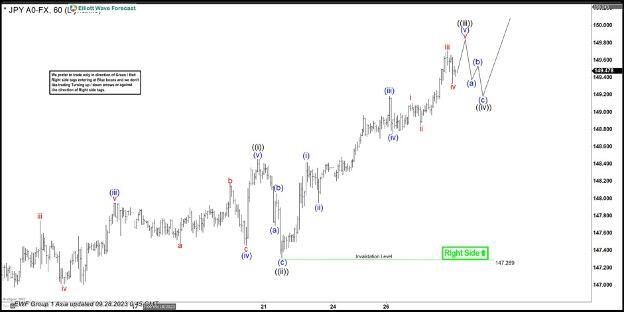
Short term Elliott Wave view suggests the USD/JPY is trading to the upside in a wave 3 following an impulse structure. Up from wave 2 at 9.11.2023 low, wave ((i)) ended at 148.46 as a leading diagonal. Wave ((ii)) made a zig zag correction (a), (b), and (c) ended at 147.29 low. From here, the pair continued the rally trading higher in wave ((iii)). 1 hour chart below shows wave ((iii)) of 3 should be near to end. Up from wave ((ii)), wave (i) ended at 148.42 and pullback in wave (ii) ended at 147.96. USD/JPY resumed rally ended at 149.19 which completed wave (iii).
Small pullback as wave (iv) ended at 148.76. Then, the pair resumed higher in wave (v) of ((iii)). We can see that wave (v) is extended and actually is trading in wave v of (v). The structure suggest that we need one more high to complete wave v of (v) and that will complete wave (v) of ((iii)) and wave ((iii)). Once wave ((iii)) is completed, USD/JPY should enter in a correction as wave ((iv)); therefore, we expect 3, 7 or 11 swings lower to end wave ((iv)) before turning higher again in wave ((v)) of 3. Near term, as far as pivot at 147.29 low stays intact, expect pair to see further upside.
USD/JPY 60 minutes Elliott Wave chart
USD/JPY Elliott Wave video
Author

Elliott Wave Forecast Team
ElliottWave-Forecast.com


