|

USD/JPY Bullish Reversal After Completing Bearish Wave-C

USD/JPY showed a strong bullish bounce after reaching 106.75 and the support trend line (blue). Is the USD/JPY ready for a larger bullish reversal?
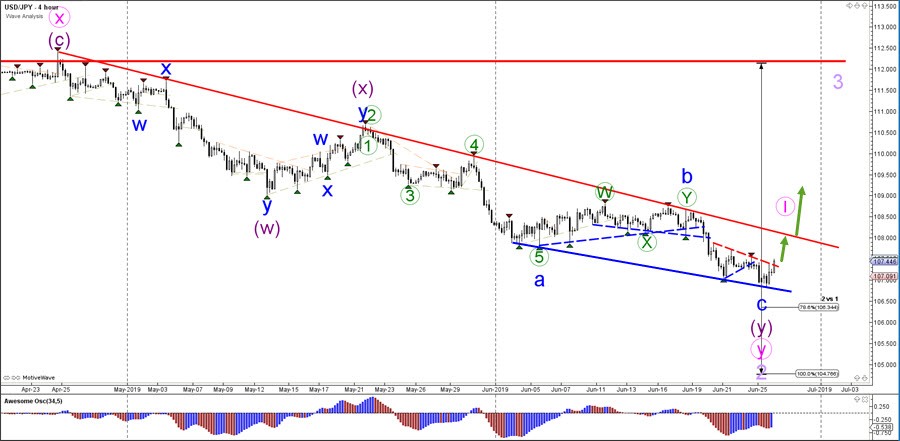
USD/JPY

4 hour

The USD/JPY could be completing a larger bearish wave 2 (purple) pattern, which would indicate that a large bearish corrective price swing has ended and a new bullish swing could be starting. Although price is showing the first signs of a new bullish swing after breaking a local resistance trend line (dotted red), price still needs to break above the larger resistance trend line (red solid) of the downtrend channel. If price does push lower, then the 78.6% Fibonacci level of wave 2 vs 1 at 106.34 is expected to act as a support zone.
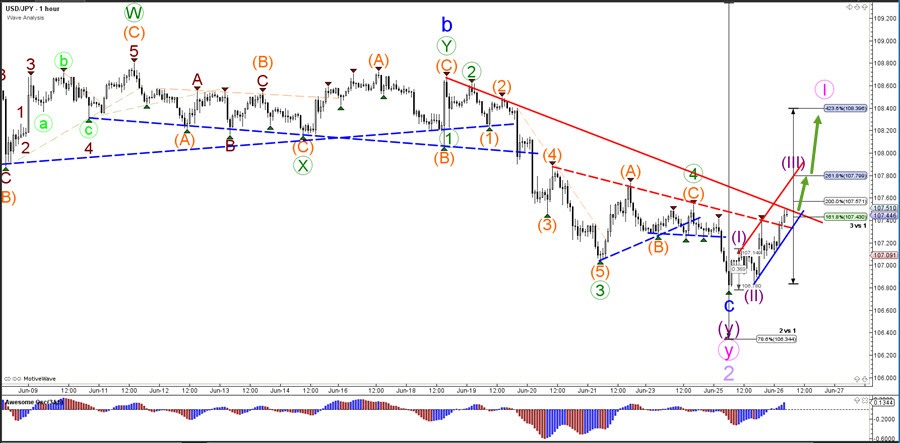
Chart

1 hour

The USD/JPY seems to have completed the bearish wave C (blue) as we expected in the previous wave analysis of the USD/JPY. Price has made a wave 4 (green) correction, which was followed by a final push lower via wave 5 of wave C (blue). Currently price is moving higher and showing strong bullish impulsive price action, which could be a wave 3 (purple) pattern.

Chart

The analysis has been done with the CAMMACD.MTF template.

For more daily technical and wave analysis and updates, sign-up up to our ecs.LIVE channel.

Author

Chris Svorcik

Chris Svorcik

Elite CurrenSea

Experience Chris Svorcik has co-founded Elite CurrenSea in 2014 together with Nenad Kerkez, aka Tarantula FX. Chris is a technical analyst, wave analyst, trader, writer, educator, webinar speaker, and seminar speaker of the financial markets.

More from Chris Svorcik
Share:

Editor's Picks

EUR/USD extends its optimism past 1.1900

EUR/USD retains a firm underlying bid, surpassing the 1.1900 mark as the NA session draws to a close on Monday. The pair’s persistent uptrend comes as the US Dollar remains on the defensive, with traders staying cautious ahead of upcoming US NFP prints and CPI data.
 

GBP/USD tilts bullish as markets barrel toward mid-week NFP print

GBP/USD is holding a broader bullish structure on the daily chart, with price trading well above the 50 Exponential Moving Average at 1.3507 and the 200 EMA at 1.3310, confirming the intermediate uptrend that has been in place since the November 2025 low near 1.2300. 

Gold pushes back above $5,000

The daily chart shows spot Gold in a parabolic uptrend that accelerated sharply from the $4,600 area in late January, printing a record high at $5,598.25 before a violent reversal erased nearly $1,000 in value during the final days of the month. 

Litecoin eyes $50 as heavy losses weigh on investors

Following a strong downtrend across the crypto market over the past week, Litecoin holders are under immense pressure. The Bitcoin fork has trimmed about $1.81 billion from its market capitalization since the beginning of the year, sending it below the top 20 cryptos by market cap.

Japanese PM Takaichi nabs unprecedented victory – US data eyed this week

I do not think I would be exaggerating to say that Japanese Prime Minister Sanae Takaichi’s snap general election gamble paid off over the weekend – and then some. This secured the Liberal Democratic Party (LDP) an unprecedented mandate just three months into her tenure.

Ripple exposed to volatility amid low retail interest, modest fund inflows

Ripple (XRP) is extending its intraday decline to around $1.40 at the time of writing on Monday amid growing pressure from the retail market and risk-off sentiment that continues to keep investors on the sidelines.