USD/CAD: Bullish engulfing daily candle getting the buyers ready

USD/CAD produced two bullish candles consecutively on the daily chart after consolidation. Yesterday’s daily candle closed within a flipped resistance. If the price keeps going towards the North and makes a daily breakout at the level of resistance, the buyers may remain busy in buying the pair for some days. Major intraday charts such as the H4 chart looks suitable for the buyers too. However, the H1 chart looks a bit choppy. Let us have a look at the Daily-USD/CAD chart.
Chart 1 USD/CAD Daily Chart
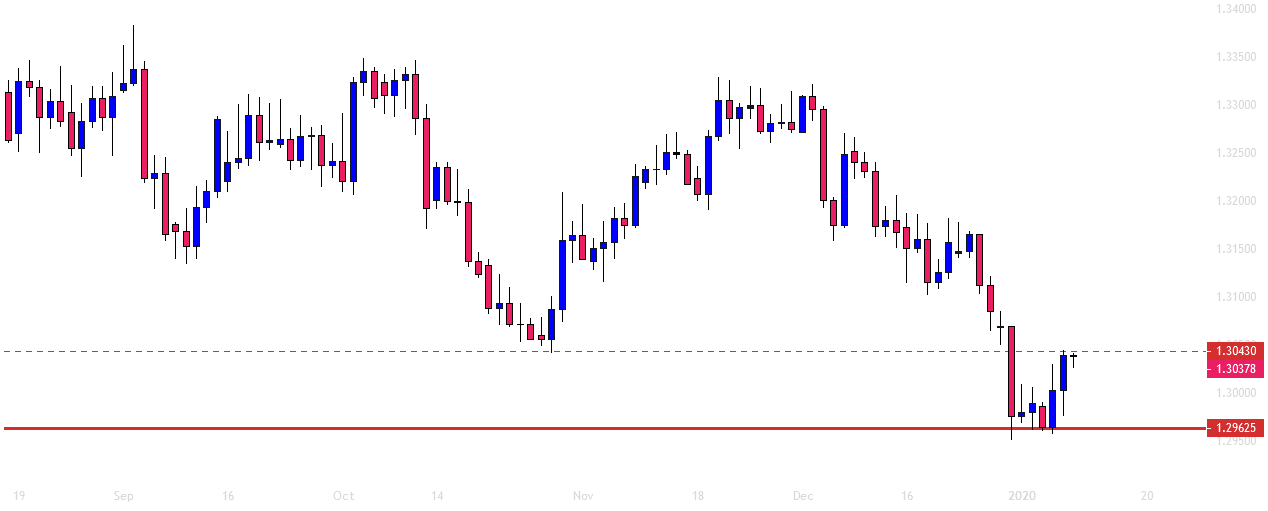
The chart shows that the price headed towards the South with good bearish momentum. It has found its support at the level of 1.29625 and consolidated for a while. Upon producing a bullish engulfing candle, it headed towards the upside yesterday as well. The candle closed within the level of 1.30430, which is a flipped resistance. If the price makes a daily breakout at this level, the buyers may go long on the pair up to the level of 1.33090.
Chart 2 USD/CAD H4 Chart
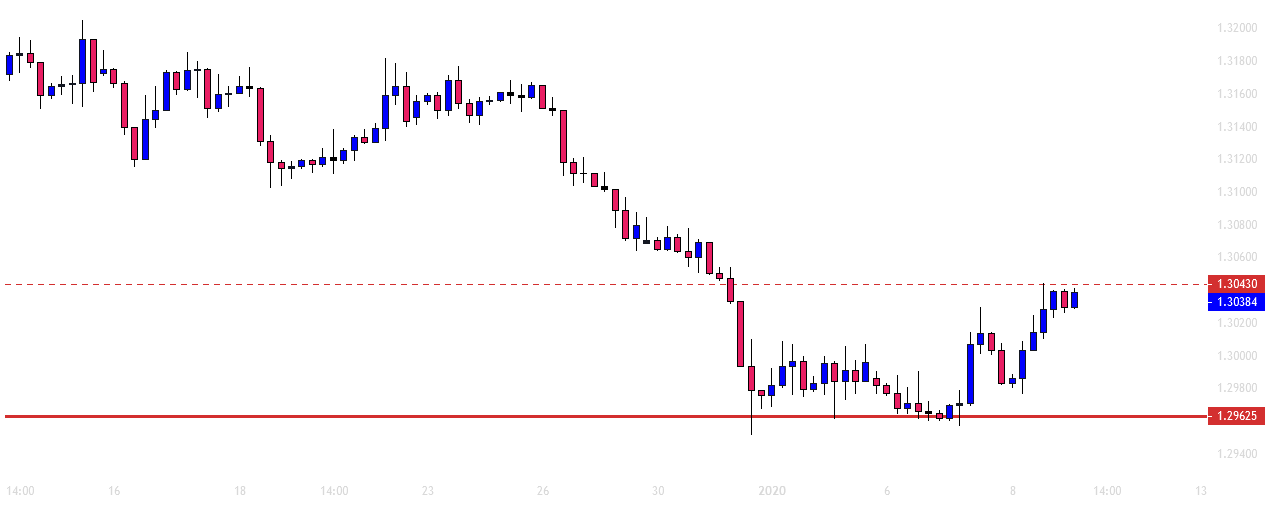
The H4 shows that the price has been on consolidation. As of writing, the price has been bullish on the last candle. If the candle closes above the level of 1.30430, the price may head towards the upside. It may find its next resistance at the level of 1.31120. Since the daily chart is bullish biased, the H4 buyers may hold their partial positions to hunt more pips. If the price breaches the level of 1.31120, it may go towards the level of 1.31675. This is the level where the H4 chart may make a long consolidation.
Chart 3 USD/CAD H1 Chart
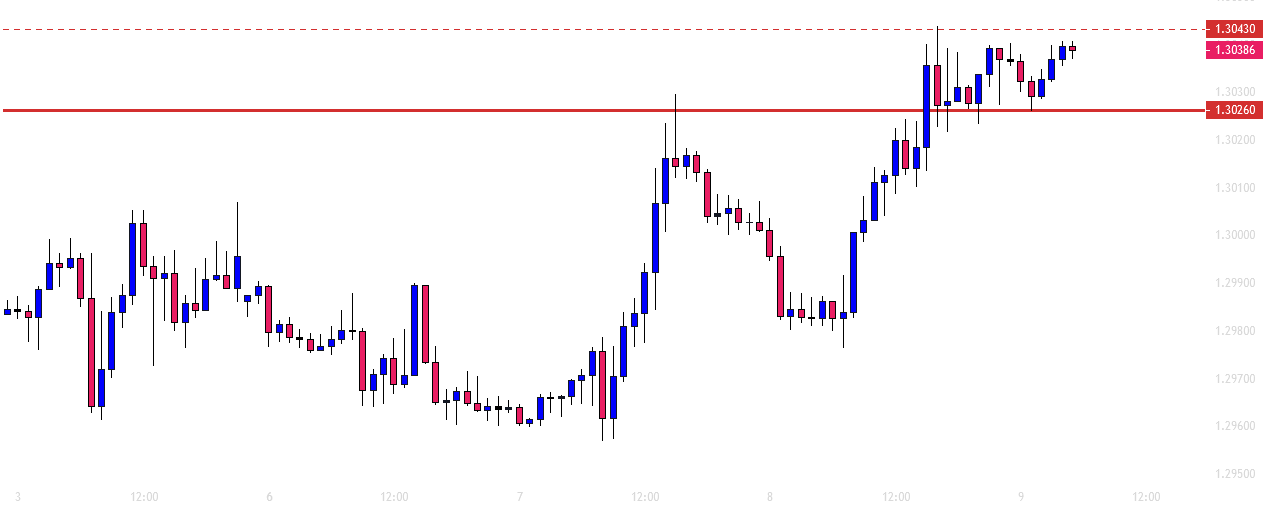
The chart shows that the price gets caught within two horizontal levels. It bounced at the level of 1.30260 twice. On the other hand, it had rejection three times at the level of 1.30430. In a word, it is going to be a strong battle. Since the daily and the H4 are bullish biased, the H1 chart may make an upside breakout. The price may find its next resistance at the level of 1.30880, which offers a lucrative risk-reward to the H1 buyers. On the other hand, triple top resistance may drive the price towards the downside and make a breakout at the level of support. In case of a bearish breakout, the price may find its next support at the level of 1.29800.
Considering these three charts, it seems that the buyers have the upper hand. A lot depends on the intraday charts. If today’s intraday charts get bullish and end up producing a daily bullish candle, USD/CAD may become a buyer's territory.
Author

EagleFX Team
EagleFX
EagleFX Team is an international group of market analysts with skills in fundamental and technical analysis, applying several methods to assess the state and likelihood of price movements on Forex, Commodities, Indices, Metals and


