USA500 persists into the 2,800 area

USA500, Daily
US Equities remained sharply elevated with relief gains of 1.5-2.1% on Wall Street after Trump’s wild press conference. This follows Wall Street’s biggest midterm election-day rally since 1982, with the USA500 closing over 2%, which is its 2nd-largest post-election rally since at least 1950 (midterm or presidential).
The USA500 cash index has rebounded by 4.3% from the 6-month low that was seen on October 29th. The rally should be seen in context of coming after sharp losses in October, which, with the midterms having largely confirmed to pre-election poll predictions, paved the way for a buy-on-fact reaction on Wall Street. The USA500 had racked up a loss of nearly 7% in October, its worst month since September 2011 and the worst October since 2008, while the tech-laden Nasdaq index had fallen by 9.2%.
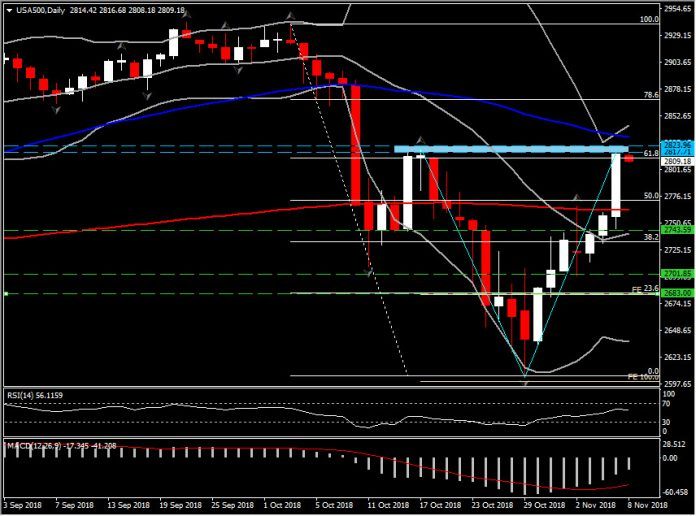
Meanwhile, yesterday, the index cleared 2.8k after closing above its resistance at 200-day MA, of 2,762.49, which coupled with very strong momentum, recovering more than the 50% of October’s losses. Currently, it is in correction mode, presently showing a 0.4% decline, struggling to hit move up to the next important barrier, which is at 2,817.70-2824.00 area. The latter is the confluence of the latest up fractal, the 61.8% Fib. retracement level and the 20-week MA, and that renders it into a strong resistance area.
The overall picture of the USA500 remains bullish with momentum indicators also confirming that there is further steam to the upwards. Momentum indicators are increasingly positively configured, suggesting to continuation of the upside movement. RSI is at 55 and rising, while MACD lines decreasing within the negative territory, presenting a decline of the negative momentum.
However as the Resistance barrier consider be strong, a close today below 2,800 level could imply to a potential pull back of the asset’s price.The huge daily bullish candle, confirmed a supportive floor around 2,742.00-2,743.60 area, which coincides with the 20-day MA and 4 consecutive days’ lows in the mid of October. Further losses below this Support could drift price to 2,683 ( FE 61.8 set on October’s rebound, and also the 23.6% Fib. level since 2,939.80 peak).
Oppositely, on a break of the Resistance area, we could see USA500 being boosted to October’s peak.
Therefore is something to be added in our watch-list , Daily and intra-day as well, since the same performance has been seen in the 4-hour chart, as figure below.
Author

With more than 4 years of experience at the Central Bank of Cyprus where he obtained hands-on experience with real-life economics, Dr Nektarios Michail is a supporter of a balanced approach between science and art when it comes to


