US S&P Global PMI Preview: Will markets continue to price in a 50 bps Fed hike?
- S&P Global PMIs are expected to come in below 50 in early November.
- Surveys' notes on input prices could impact the USD's valuation.
- Markets are pricing in a 71.1% probability of a 50 bps Fed rate hike in December.

The level of business activity in the US will come under scrutiny when S&P Global releases the preliminary findings of its US private sector business activity surveys for November, on Wednesday, November 23. Markets expect the Manufacturing Purchasing Managers Index (PMI) to decline to 49.8 from 50.4 and the Services PMI to edge lower to 47.7 from 47.8. Since any reading below 50 signals contraction in the sector, the data is expected to reveal that both the service and manufacturing sectors’ experienced an overall reduction in economic activity from the month before.
Why is this significant? PMIs are considered to be leading indicators since they are based on the decisions of business managers, who constantly try to foresee future sales and project costs. A steady decline in PMI readings could be seen as a sign that businesses are preparing for an economic downturn. If the economy is slowing down, the Fed is likely to take a lighter touch approach to monetary policy, which would be overall negative for the US Dollar.
This would be nothing new – since mid-2021, the Manufacturing and the Services PMIs in the US have been declining as shown in the charts below. In the most recent survey, “the fall in client demand was broad-based, as manufacturers and service providers noted contractions,” S&P Global noted. “Dollar strength and inflation weighed on new export orders which fell further.”
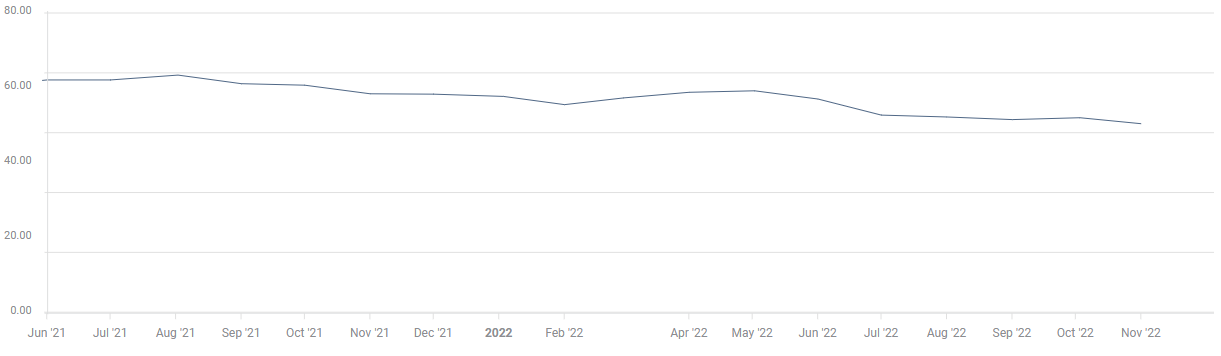
S&P Global Manufacturing PMI chart
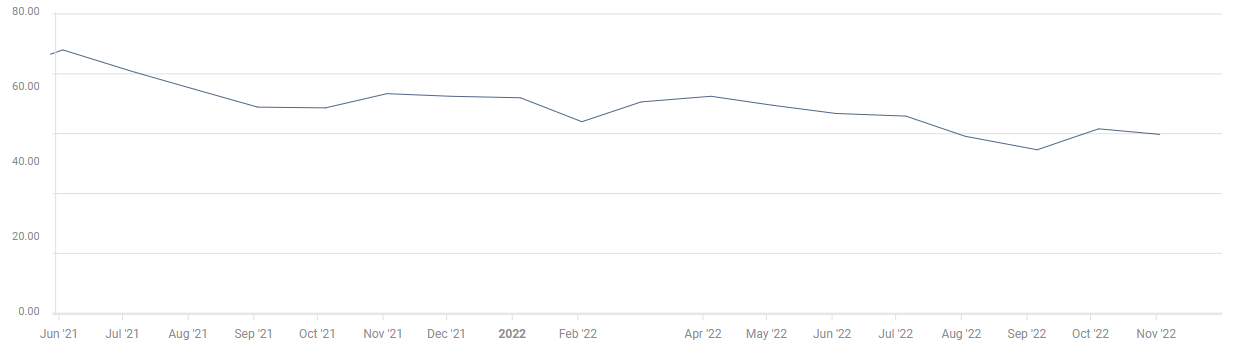
S&P Global Services PMI chart
Market implications
The US Dollar (USD) came under constant selling pressure in early November as markets started to price in a 50 basis points Federal Reserve (Fed) rate hike in December. The softer-than-expected Consumer Price Index (CPI) figures for October revived optimism that the US central bank could adopt a less aggressive tightening stance moving forward and allowed investors to unwind crowded USD longs.
How do the PMI’s fit into the inflation narrative? Well, assessing the October PMI reports, Siân Jones, Senior Economist at S&P Global Market Intelligence, noted that input costs rose at the slowest pace in nearly two years amid signs of reduced supply chain disruptions in the manufacturing sector. “Momentum in previously soaring inflation slowed again,” Jones further elaborated. “Hikes in costs softened, as service providers and manufacturers saw slower upticks in supplier and input prices.”
In case the preliminary November PMI reports unveil a contraction in the private sector’s business activity and show that price pressures continued to soften as well, the US Dollar (USD) is likely to have a hard time finding demand. According to the CME Group’s FedWatch Tool, markets are currently pricing in a 71.1% probability of a 50 bps Fed rate hike in December, suggesting that there is room for further USD weakness if investors ramp up bets even higher for a smaller rate increase after the PMI data.
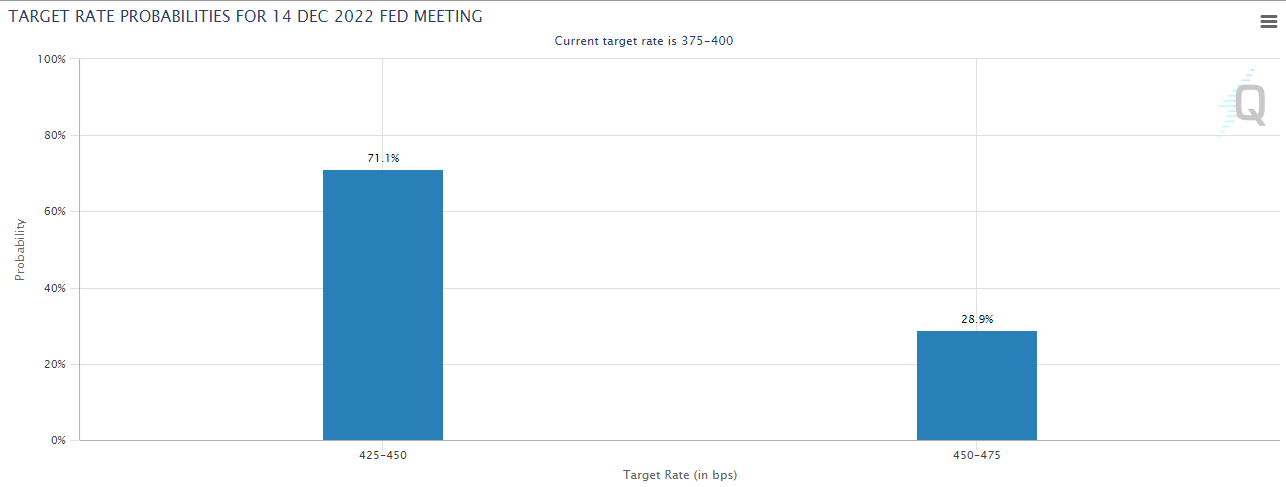
Source: CME Group
On the other hand, an unexpected rebound in headline PMIs is likely to provide a boost to the USD. If better-than-forecast PMIs are accompanied by commentary suggesting that input prices are rising again, however, the positive impact on the USD is likely to remain short-lived.
It’s worth noting that the US Federal Reserve will release the minutes of its October meeting later in the day. Hence, investors could refrain from taking large positions based on PMI data alone and opt to wait to see the Fed’s publication.
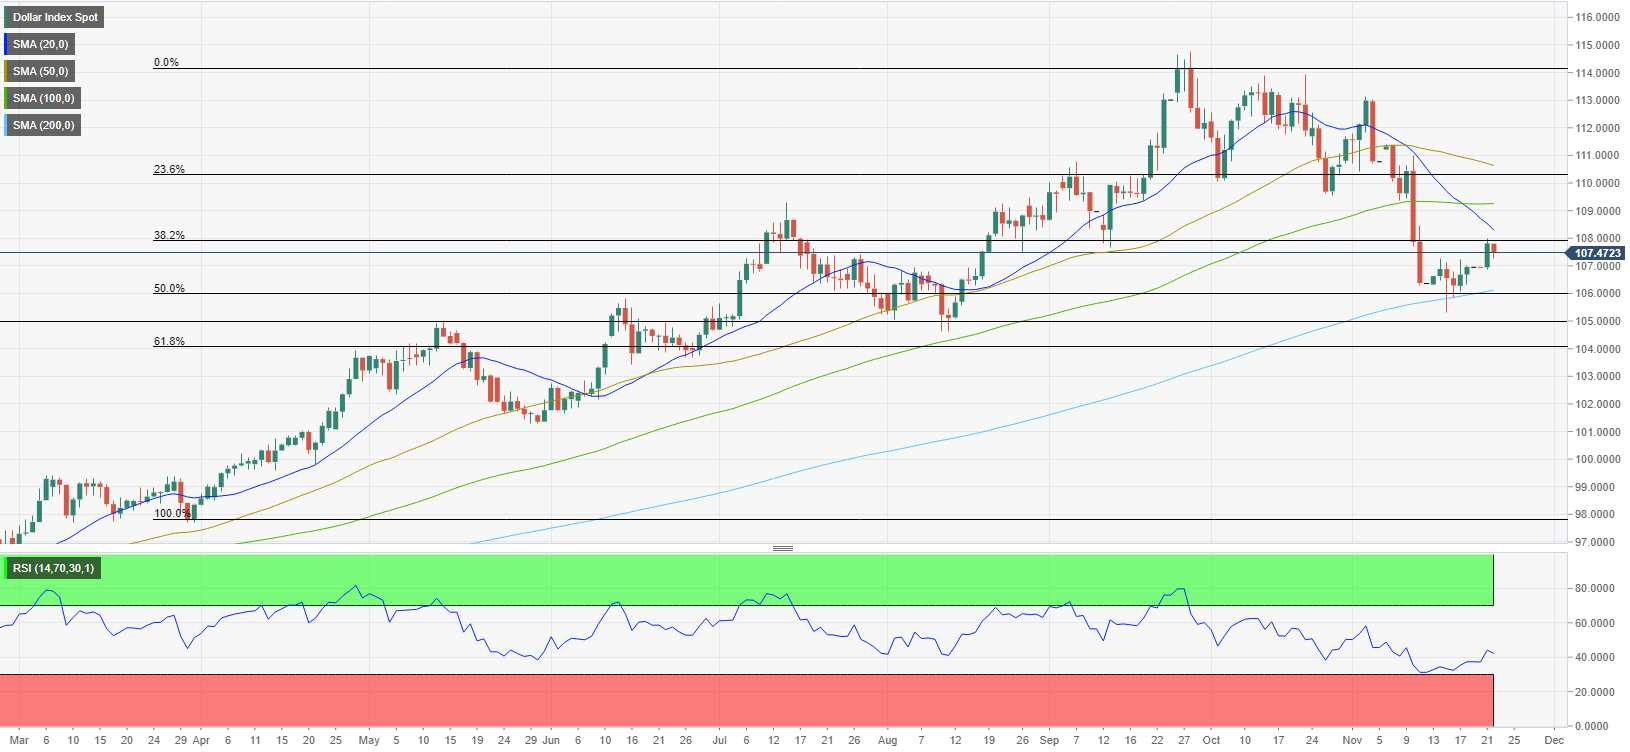
US Dollar Index Technical Outlook
The US Dollar Index’s latest rebound may have been more a technical correction rather than a reversal, given the Relative Strength Index (RSI) indicator on the daily chart started to edge lower before reaching 50. Additionally, the US Dollar Index continues to trade below the 20-day, 50-day and 100-day Simple Moving Averages (SMA).
On the upside, strong resistance seems to have formed at 108.00, where the Fibonacci 38.2% retracement of the March-October uptrend and the 20-day SMA align to form a double cap. In case the index rises above that level and starts using it as support, it could target 109.00 (100-day SMA) and 110.00 (psychological level, Fibonacci 23.6% retracement).
To the downside, 106.00 (200-day SMA, Fibonacci 50% retracement) aligns as significant support. If buyers fail to defend that level, an extended slide toward 105.00 (static level, psychological level) could evolve, and even to 104.00 (Fibonacci 61.8% retracement) witnessed.
Author

Eren Sengezer
FXStreet
As an economist at heart, Eren Sengezer specializes in the assessment of the short-term and long-term impacts of macroeconomic data, central bank policies and political developments on financial assets.


