US rates and a triple whammy of obstacles to overcome

The good (AI), the bad (deficits) and the ugly (inflation) extend well beyond the US, with similar dynamics at play in France, Japan and the UK. While our focus here is the US, many of the same themes apply elsewhere. We think it will prove tough to shake off these impulses through the end of 2026 and into the first quarter of 2027.
We expect the 10yr Treasury yield to remain under upward pressure into the first quarter of 2027. AI-driven productivity growth, elevated fiscal deficits and sticky inflation are capable of pushing it back towards 5.25%, and potentially as high as 5.5%. A material constraining factor would be the US Treasury cutting long-end funding.
Looking beyond the first quarter, we identify a key shift in inflation dynamics as a dominant factor. Specifically, the direction should reverse later in 2027 as inflation eases and the market starts to re-discount Federal Reserve rate cuts, ultimately taking the 10yr towards the 4.5-4.75% area. But we should not jump to that too early, especially with upward pressure on inflation still very much in focus as we head into 2027.
The drivers of long tenor rates
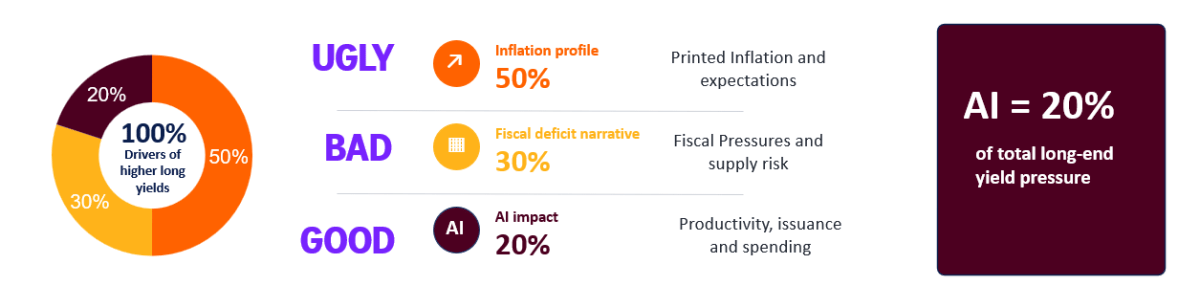
Let’s break this out, starting with the 'good' (not all rate increases are for sinister reasons).
The good – AI-sparked productivity growth (and issuance)
We link the AI angle with productivity growth. We continue to view this as highly impactful for market rates, although not as much as the combination of inflation and the fiscal deficit. But we think productivity growth has been a significant driver of the previous elevation in real yields, and for 2027 it remains very impactful.
The nuance for 2027 is that we run the risk that AI-related issuance pressure begins to eclipse AI-driven productivity growth. We had significant issuance throughout 2026. It was novel at first, and mostly well absorbed. But as the stock of outstanding debt increases further, its crowding-out effect becomes more structurally impactful.
The AI impact is still about a fifth, but issuance impact is on the rise

The real yield is very important as a key driver of nominal yields. Inflation expectations, as measured by the 10yr Treasury yield minus the 10yr real yield on inflation-protected securities, do not typically engage in big directional swings. It’s the real yield that does that. Productivity growth has always been a contributing factor. But of late, the AI revolution has added an impulse.
We’re also of the opinion that higher printed inflation shows up partly in the real yield in the guise of an added term premium. On top of that, the fiscal deficit has a similar effect, through its influence on the supply of Treasuries. It also affects demand for Treasuries through the prism of investors’ perception of the Treasury product and the price they are willing to pay for it.
Printed inflation vs 10yr inflation expectations and real yield
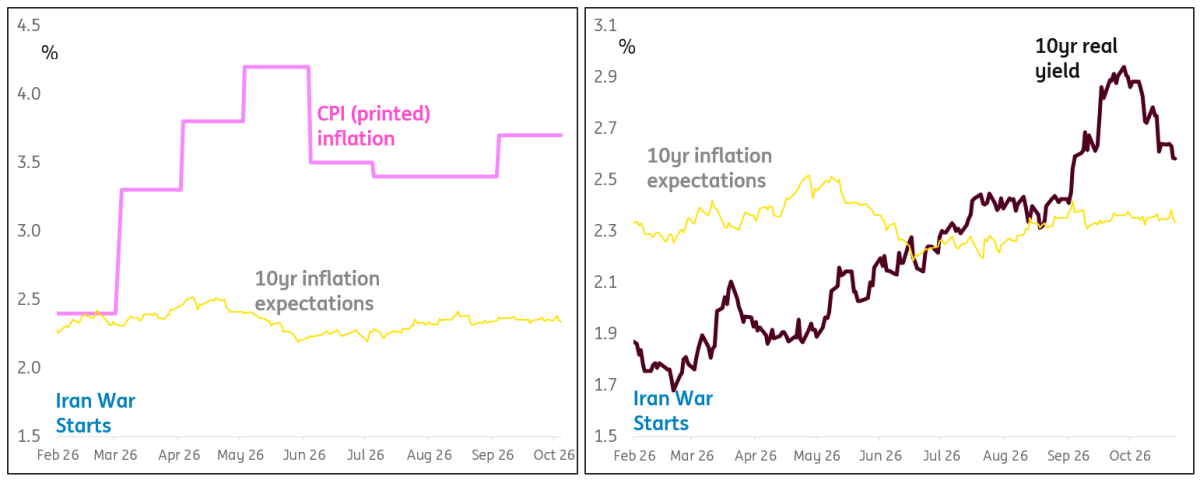
There is a lot going on here, but the bottom line is that where the real yield goes, the nominal Treasury yield goes. And for 2027, a combination of productivity growth, deficit pressure and a stretch in the term premium continues to place upward pressure on the real yield.
The bad – elevated fiscal deficit(s)
Fiscal deficits are not going to magically solve themselves in the coming months. So, the year ahead will remain a year of concern for debt dynamics. There is quite a degree of gradualism in play, which mutes reactions. But as we saw with Greece a decade and a half ago, the market can quickly jump to a state where debt dynamics suddenly become unpalatable, long before we actually hit a tipping point. Policy stasis is a real problem here, as it leaves a vacuum for bond markets to dip into whenever deemed appropriate.
For this reason, the tame evolution of US swap spreads is worth commenting on. In part, it reflects Treasury Secretary Bessent’s increase in long-end buybacks, with the implied threat of more. Moreover, it’s been bolstered by fast-money players taking advantage of an implied cap on swap spreads, through longs in Treasuries and payers in swaps. The upshot has been a further tightening in US swap spreads.
US 10yr Swap Spread
10yr Treasury yield minus 10yr SOFR rate.
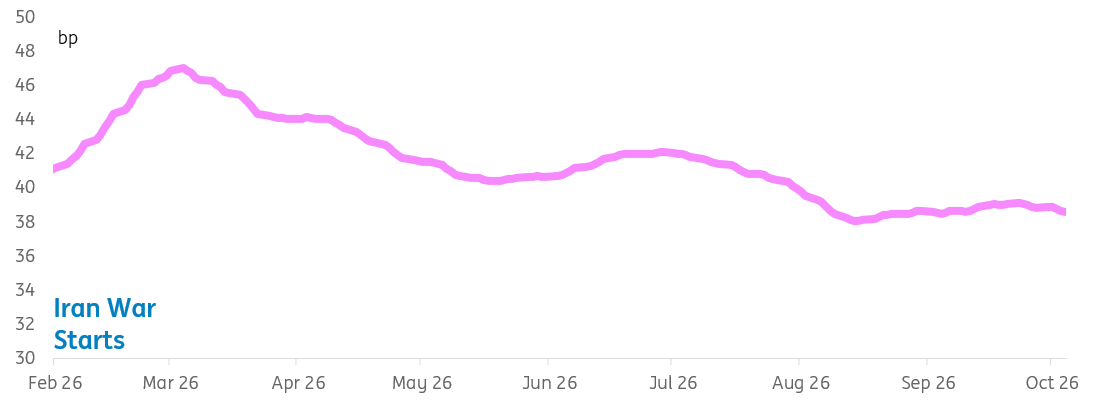
Barring an aggressive Treasury decision to cancel some long-end auctions and/or add to buybacks, we’d prefer to fade this move. We think that swap spreads should come under re-widening pressure as a theme through 2027, or at least through the first quarter. We think the 10yr swap spread can revert to the 50bp-plus area for starters (now below 40bp). And the 30yr can move back up to 75bp, at least.
But again, as intimated above, a material reduction in long-end Treasury issuance would provide a pathway to tempering the direct negative effects associated with the fiscal deficit narrative. Our impression is there is no huge urgency to do so, especially given the relative tameness of swap spreads currently. But then again, this is at the whim of the Treasury Secretary in the end.
The ugly – inflation sparked the sell-off (but is also the most likely route for a reversal)
On inflation, we assert that the spark for the sell-off in bonds in February 2026 was the Iran war. The key element is elevated printed inflation. Later in the year, a key swing factor will be our expectation for inflation to fall back to acceptable levels. Once there, markets will sense that central bank rate hikes have concluded. The subsequent path of least resistance will see rate cuts discounted, on the theory that we have peaked and that the landing level is deemed to be above neutrality. This is big, as the current market has not yet discounted a material subsequent rate cut process. Re-pricing one automatically drags longer-dated swap rates lower, at the very least, as these are present valuations of the forward profile for floating rates.
That all being said, herein also lies the biggest risk case for 2027 – that inflation does not ease enough to comfort central banks, or indeed bond markets. The current market discount appears to have this as an elevated risk factor. We glean this from the implied elevated discount for central bank rates. Longer-tenor market inflation expectations are, in fact, quite benign. But we suspect that these are not necessarily providing us with a solid steer on inflation risks for 2027 specifically. In this more bearish case, bond markets don’t get to a state of relief. That is also why we don’t want to play the bond-bullish game too early in 2027.
Are we going to 6% for the 10yr? Probably not, but here is how it could happen
While we’ve put the drivers neatly into different buckets, the reality is that they are all acting in unison. We bond nerds will, of course, go heavy on real rates being the dominant driver, which remains technically true to date. But the genesis of higher real rates is no big mystery. There has in large part been a move away from unusually low (to negative) post-pandemic levels to above-normal ones today. And we should be above normal, given that we have elevated inflation, elevated fiscal deficits (and the AI angle).
The US 10yr real yield through the cycles
The yellow bars show where GDP growth YoY printed at or above 3%.
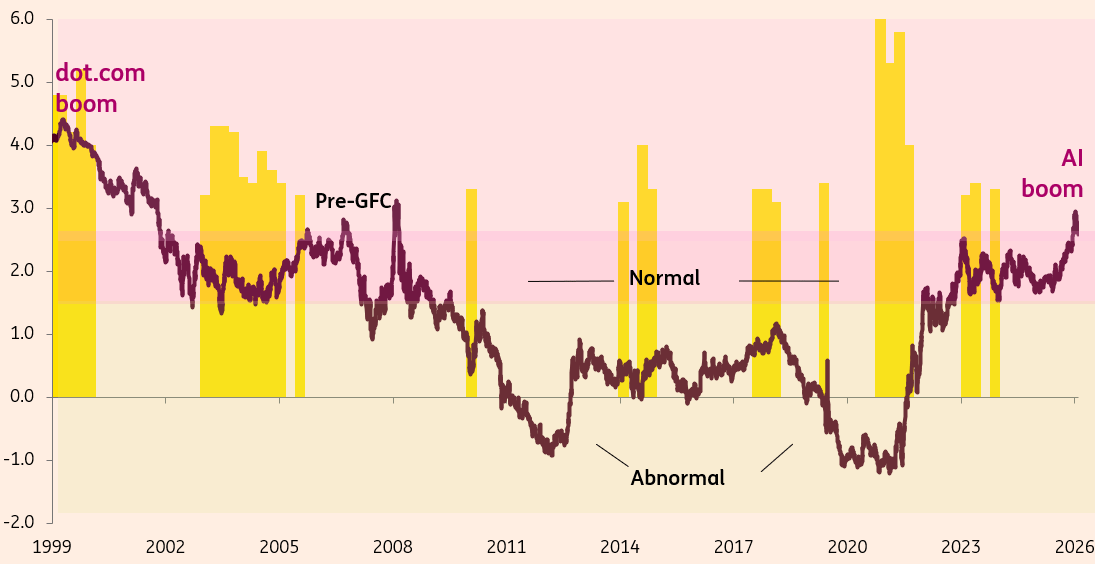
Wondering what’s normal for the 10yr nominal yield? See it here – we called this literally years ago.
The question is, should or could long-dated yields push higher from here? The answer is yes, they could. There are three routes.
- Route one is GDP growth heading to 3-4%, akin to what we saw during the dotcom boom. That could coax the 10yr real yield from below 3% currently, up towards 4%. That would mean the 10yr Treasury yield heads to 6%.
- Route two is the fiscal deficit getting materially worse. Remember, it’s been in the 6-6.5% range for about three years. Not good, but not getting worse. But what if it shot to the 7-8% zone? We don’t call for it. Get there, and again, we find a route to 6%.
- Route three is one we’ve alluded to already: inflation remains sticky in the 3% area and does not get lower, much to the frustration of the Federal Reserve. Or it gets worse, because of a severe El Niño effect, for example. Again, there is a path to 6%.
We're not calling for any of these. But they are all entirely plausible with uncomfortably high probabilities. Instead, though, our central view is more driven by stability in growth and the deficit and an easing in inflation as we progress through 2027.
Our baseline view targets 5.25-5.5% (and then 4.5-4.75% later in the year)
Our baseline view centres on the good, the bad and the ugly causing enough trouble in the coming months, and right through the first quarter of 2027 at least, to prompt a return to the 5.25%-plus area (vs 4.9% currently). We’d be tempted to cap the upside at 5.5%, given that by 2027 the backdrop is likely to feature GDP growth and inflation both settling into a 2%-plus range, alongside a stable rather than deteriorating debt narrative.
The drop in inflation here is key, as that allows the Federal Reserve to step away and for the market to re-discount cuts. That in turn allows long-dated yields to edge lower, with the 10yr targeting 4.75% for starters and likely settling in the 4.5-4.75% zone. This is still above normal, but rightly so.
The one big unknown is whether the US Treasury might decide to make ad hoc changes. We assume nothing big. But a decision to materially reduce long-dated issuance sizes would be big, for example. Our baseline view is that such a measure is reserved for a period of market stress or systemic threat, where de facto yield curve control might be an option. Again, not what we expect.
Author

ING Global Economics Team
ING Economic and Financial Analysis
From Trump to trade, FX to Brexit, ING’s global economists have it covered. Go to ING.com/THINK to stay a step ahead.