US PPI confirm inflation easing, steady UK economy, US socks further up, Crude again higher

Previous trading day events – 13 July 2023
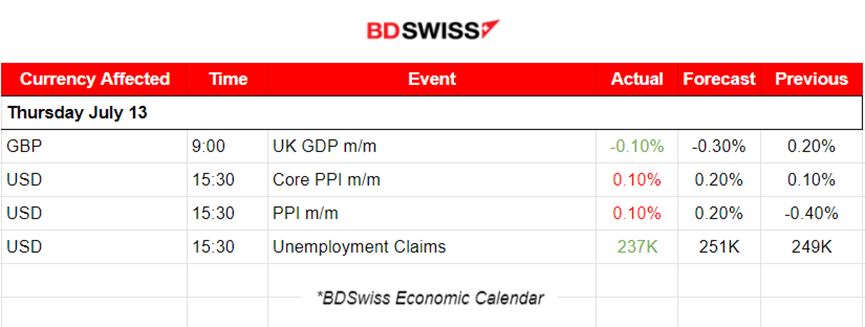
- The U.K. monthly real Gross Domestic Product (GDP) figure reported yesterday suggests that GDP is estimated to have fallen by 0.1% in May 2023 after a growth of 0.2% in April 2023. A less negative figure than the expected -0.3%.
-
A series of upward surprises for the U.K. made it possible to avoid a recession that forecasters, including the Bank of England and International Monetary Fund, had expected earlier this year.
-
“Overall, consumption growth could remain sluggish until well into next year as households face multiple economic headwinds,” said Yael Selfin, chief economist at KPMG UK. “While stronger pay growth and falling inflation could see real incomes start growing again, the impact of higher mortgage costs and rising rents could weigh on household spending.”
-
“Today’s GDP figure showing 0% growth in the three months to May provides further evidence of the precarious state of the UK economy,” said David Bharier, head of research at the British Chambers of Commerce. “Most firms are still not reporting improved business conditions.”
-
-
Analysts will keep a close eye on June’s data.
-
“June’s data will likely be flattered by a return to the usual number of working days,” said Ben Jones, lead economist at the CBI employers group. “Activity in the private sector has remained firm in recent months.”
-
“UK GDP held up better than expected in May despite the drag from an extra national holiday. The reading adds to the picture of a resilient economy that’s keeping price pressures elevated and will do little to quell the Bank of England’s hawkishness. Our baseline view is that the central bank will have to engineer a recession to get inflation under control.” said Dan Hanson and Ana Andrade, Bloomberg Economics.
-
“Perhaps perversely the Bank of England may take some comfort from this weaker output data, as it suggests demand may be cooling, which in turn reduces inflationary pressure,” said Kitty Ussher, chief economist at the Institute of Directors.
-
-
The U.S. Producer Prices Index (PPI) data released yesterday showed that U.S. producer prices barely rose in June and the annual increase in producer inflation was the smallest in nearly three years; a change of 0.1% last month, as per the Labor Department.
-
In the last 12 months through June, the PPI gained 0.1%, the smallest year-on-year rise since August 2020, while the core PPI advanced 2.6% after increasing 2.8% in May.
-
Inflation is apparently easing. Demand for goods slows in response to higher interest rates.
-
Winners vs losers
-
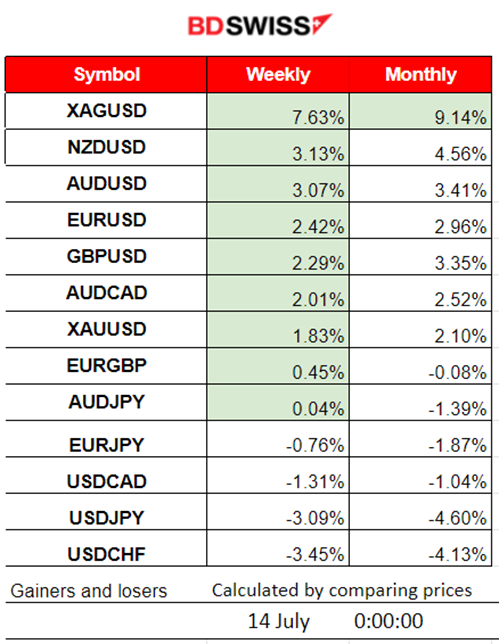
Silver (XAGUSD) remains on the top of the winner’s list for the week and for the month as well, with 7.63% and 9.14% respectively.
-
It is quite obvious that the markets are currently driven by the USD. The pairs having USD as the quote currency climb higher and higher as USD is weakening by the day.
News reports monitor – Previous trading day (13 July 2023)
Server Time / Timezone EEST (UTC+03:00).
1. Midnight – Night session (Asian)
No major news announcements, no special scheduled releases.
2. Morning – Day session (European)
At 9:00, the monthly change for the U.K. Gross Domestic Product was released, and it was less negative than expected. GDP is estimated to have fallen by 0.1% in May and at the time of the release, some GBP appreciation was observed.
At 15:30, the U.S. PPI figures were released showing that the Producer Price Index (PPI) for final demand increased by 0.1 % in June. This is the slowest YoY PPI figure since August 2020. The PPI shows that further deflation is imminent with intermediate- demand goods prices down by over 9% YoY. There was not a great shock taking place at that time, however, the USD has weakened even further, steadily depreciating against other currencies as all inflation-related figures are reported lower than expected. Good for the Fed, yes, but how about the economy?
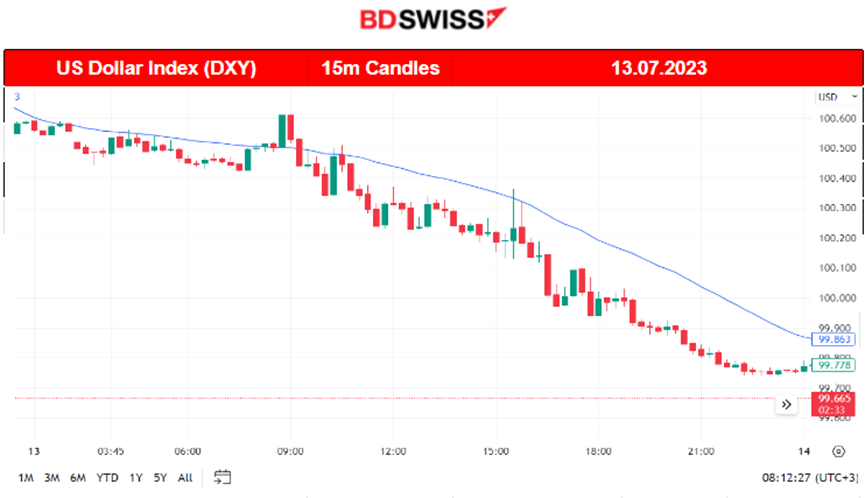
At the same time, the U.S. Unemployment claims were reported to have dropped by just 12,000 to 237K. That is still a high number for claims though. Since April, these numbers went over 200K and remained well above that threshold in a range of 230K-265K. The most recent data show that the number is lowering, showing Labour market resilience. However, the market decided that the Dollar is no longer desirable. Yesterday, the DXY moved all the way down without any retracements, but steadily on the downtrend.
General verdict
-
The Dollar weakening continues as the annual inflation rate figures are reported quite low. CPI and PPI changes seem to coincide.
-
Volatility during the N. American session, U.S. Stocks higher, Crude higher.
-
Gold settled at around the mean 1960 USD/oz.
Forex markets monitor
EUR/USD (13.07.2023) Chart Summary
Server Time / Timezone EEST (UTC+03:00).
Price movement
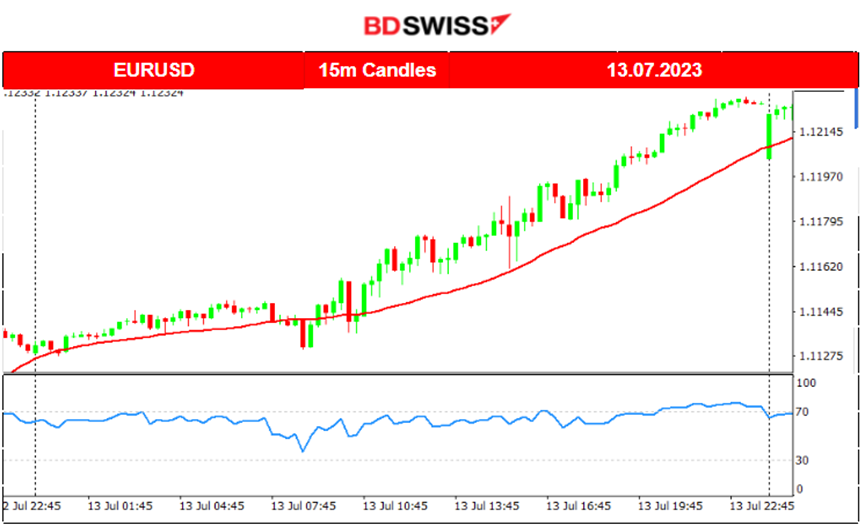
It is quite obvious that the EURUSD moved on an intraday upward trend because of the USD depreciation. It is mirroring the DXY chart. As the USD weakens because of the recent U.S. data regarding inflation and the labour market condition, all pairs experience a strong steady upward movement (with USD as the quote currency). The scheduled figures, especially the ones at 15:30, had some impact on the pair but not a significant shock. The pair started to move to the upside as soon as the European session was near and did not stop until the end of the trading day.
Equity markets monitor
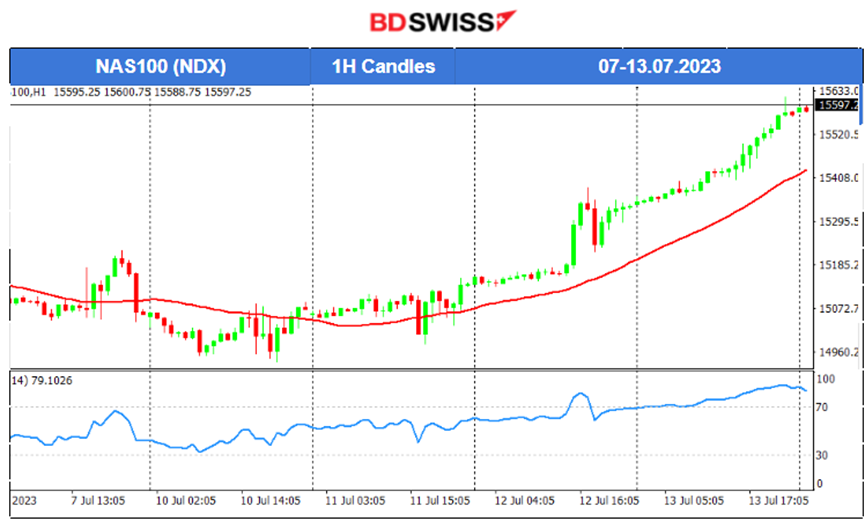
NAS100 (NDX) 4-day chart summary
Server Time / Timezone EEST (UTC+03:00).
Price movement
The U.S. stock market reversed. The recent data regarding the U.S. labour market are in favour of a revision of the decision to hike by the Fed. An interest rate policy change is more likely in the eyes of the market participants since the NFP showed way lower than expected employment change and a low annual inflation figure that had dropped remarkably to 3% already. The inflation rate data release caused the NAS100 to jump on the 12th of July. On the 13th, the PPI data were released showing also low figures. As the USD depreciated steadily, the NAS100 moved steadily upwards for the whole trading day.
Commodities markets monitor
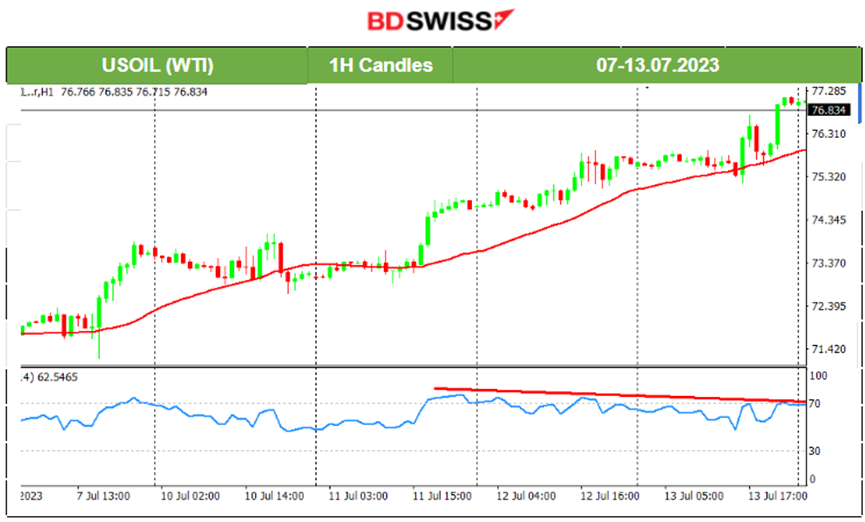
US Oil (WTI) 4-day chart summary
Server Time / Timezone EEST (UTC+03:00)
Price movement
The Oil price is following an upward path formed by the OPEC meetings’ recent statements and other factors. The trend continues and the price moves steadily upwards. On the 12th of July, it reached 75.90 USD/b. Yesterday, on the 13th, it even reached near 77 USD/b.
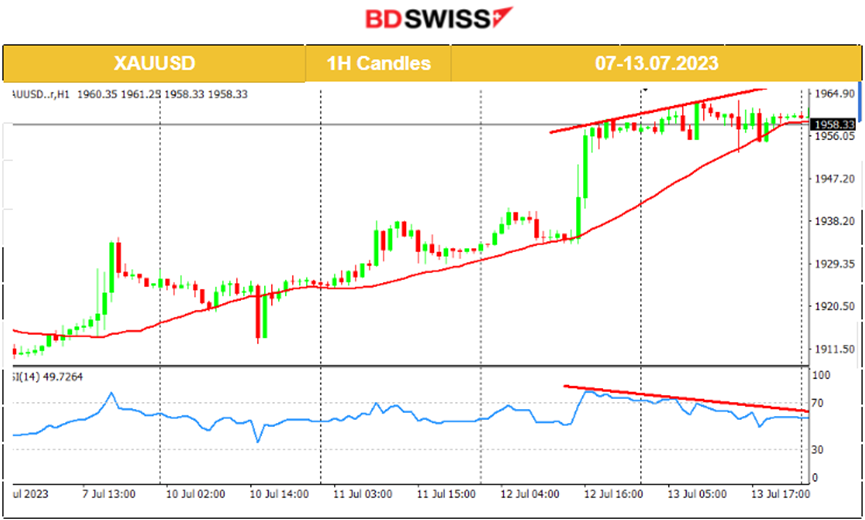
XAU/USD (Gold) 4-day chart summary
Server Time / Timezone EEST (UTC+03:00)
Price movement
On the 12th of July, the lower-than-expected inflation figure caused high depreciation of the USD and caused the Gold price to jump. There is USD weakening in general pushing Gold to climb higher and higher. However, the U.S. PPI data had no impact, and the fact that the USD had depreciated fast yesterday, while Gold was steady on the sideways shows signs that the upward movement might have paused. The RSI shows signs of bearish divergence as the lower highs are hard to miss. The levels near 1954.50 act as an important support that if it breaks we might see a rapid drop.
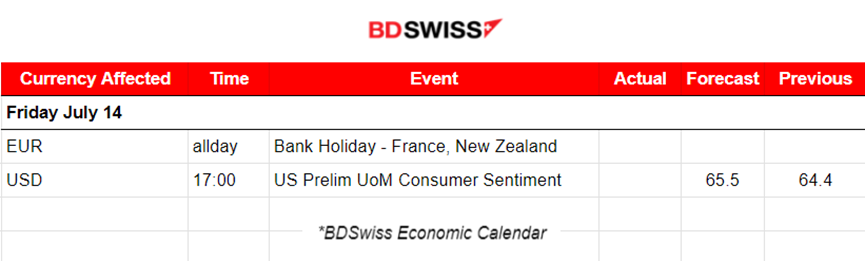
News reports monitor – Today trading day (14 July 2023)
Server Time / Timezone EEST (UTC+03:00).
1. Midnight – Night session (Asian)
No major news announcements, no special scheduled releases.
2. Morning – Day session (European)
At 17:00, the Prelim UoM Consumer Sentiment report will be released, probably causing an intraday shock but is not expected to be great. The market is already reacting to the U.S. economic data with a strong consensus causing the USD to weaken. Plus, it's Friday.
General verdict
- More volatility than on a typical Friday.
- Strong steady moves yesterday on one side might trigger retracements today.
- No major shocks are expected, there is an absence of important releases except the one at 17:00.
Author

BDSwiss Research Team
BDSwiss
BDSwiss is a leading financial institution, offering bespoke CFD trading and investment products to more than 1.7 million registered clients, in over 180 countries.


