US-Iranian conflict monopolises headlines

The US-Iranian conflict over the weekend monopolises headlines as investors are bracing for the possible impact on the markets. Overall, a risk-off sentiment prevails yet the flight to safe-haven instruments such as gold was moderate. Oil prices rallied in today’s opening, as practically the Straits of Hormuz are closed, hindering the oil supply of the international markets. Please note that Iran has not, at least as these lines are written, mined the Straits of Hormuz, a move that would signal a more decisive action. We note that the rally of oil prices was intense despite OPEC actually announcing over the weekend a modest hike in production levels, which should ease market worries somewhat. On the other hand, the US attack seems to have failed to create cracks in the Iranian regime, which could imply a prolongment of the military conflict or a return to the negotiating table at some point, yet that seems remote currently. Should we see further escalation in the conflict, we expect the risk-off sentiment of the markets to intensify and oil prices to continue to gain while on the flip side a possible thawing of tensions which at the current stage seems unlikely, could ease the market’s cautious stance. Furthermore, as the market digests the developments, we may see a correction lower for oil prices and gold, while bearish tendencies for riskier assets such as US equities could be tamed. In the FX market, the USD index gained while we note the weakening of the EUR and the JPY, with the former being in a particularly tight spot energy-wise.
Other highlights for the day
Today we get UK’s nationwide house prices for February, Germany’s and the UK’s final manufacturing PMI figures for February and the US ISM manufacturing PMI figure for the same month. On a monetary level, we note that ECB President Christine Lagarde, BoC Deputy Governor Kozicki and RBA Governor Michelle Bullock are speaking. In tomorrow’s Asian session, we note the release of Australia’s building approvals for January and current account balance for Q425.
As for the rest of the week
On Tuesday we get Turkey’s CPI rates for February and the Euro Zone’s preliminary HICP rate for the same month. On Wednesday we get Australia’s real GDP rate for Q4, China’s NBS and Manufacturing PMI figures for February, Switzerland’s and the Czech Republic’s CPI rates for February and from the US the ISM non manufacturing PMI figure also for February. On Thursday we get Australia’s trade data for January, Sweden’s preliminary CPI rates for February and the weekly US initial jobless claims figure. On Friday we get Germany’s industrial orders for January, UK’s Halifax House prices for February, Euro Zone’s revised GDP rates for Q4, Canada’s leading index for February, the US retail sales for January and the highlight is expected ot be the US employment report for February with its NFP figure.
Charts to keep an eye out
WTI’s price rallied reaching at some point $74.50 per barrel before correcting below the 73.35 (R1) resistance line. The RSI indicator breached the reading of 70, implying a strong bullish market sentiment yet also that WTI’s price is at overbought levels. Should the bulls maintain control, we may see WTI’s price breaking the 73.35 (R1) resistance line and start aiming for the 76.60 (R2) resistance base. Should the bears be in charge, we may see WTI’s price breaking the 70.00 (S1) support line and continue to break also the 66.20 (S2) level.
USD/JPY rose in today’s Asian session, aiming for the 157.60 (R1) resistance line. We intend to maintain a bullish outlook for the pair as long as the upward trendline guiding it remains intact. Should the bullish outlook be maintained, USD/JPY may break the 157.60 (R1) line and start aiming for the 159.45 (R2) level. For a bearish outlook to emerge for the pair we would require USD/JPY to break the prementioned upward trendline and continue to break also the 154.30 (S1) level and the 152.10 (S2) support level.
Calendar follows
WTI daily chart
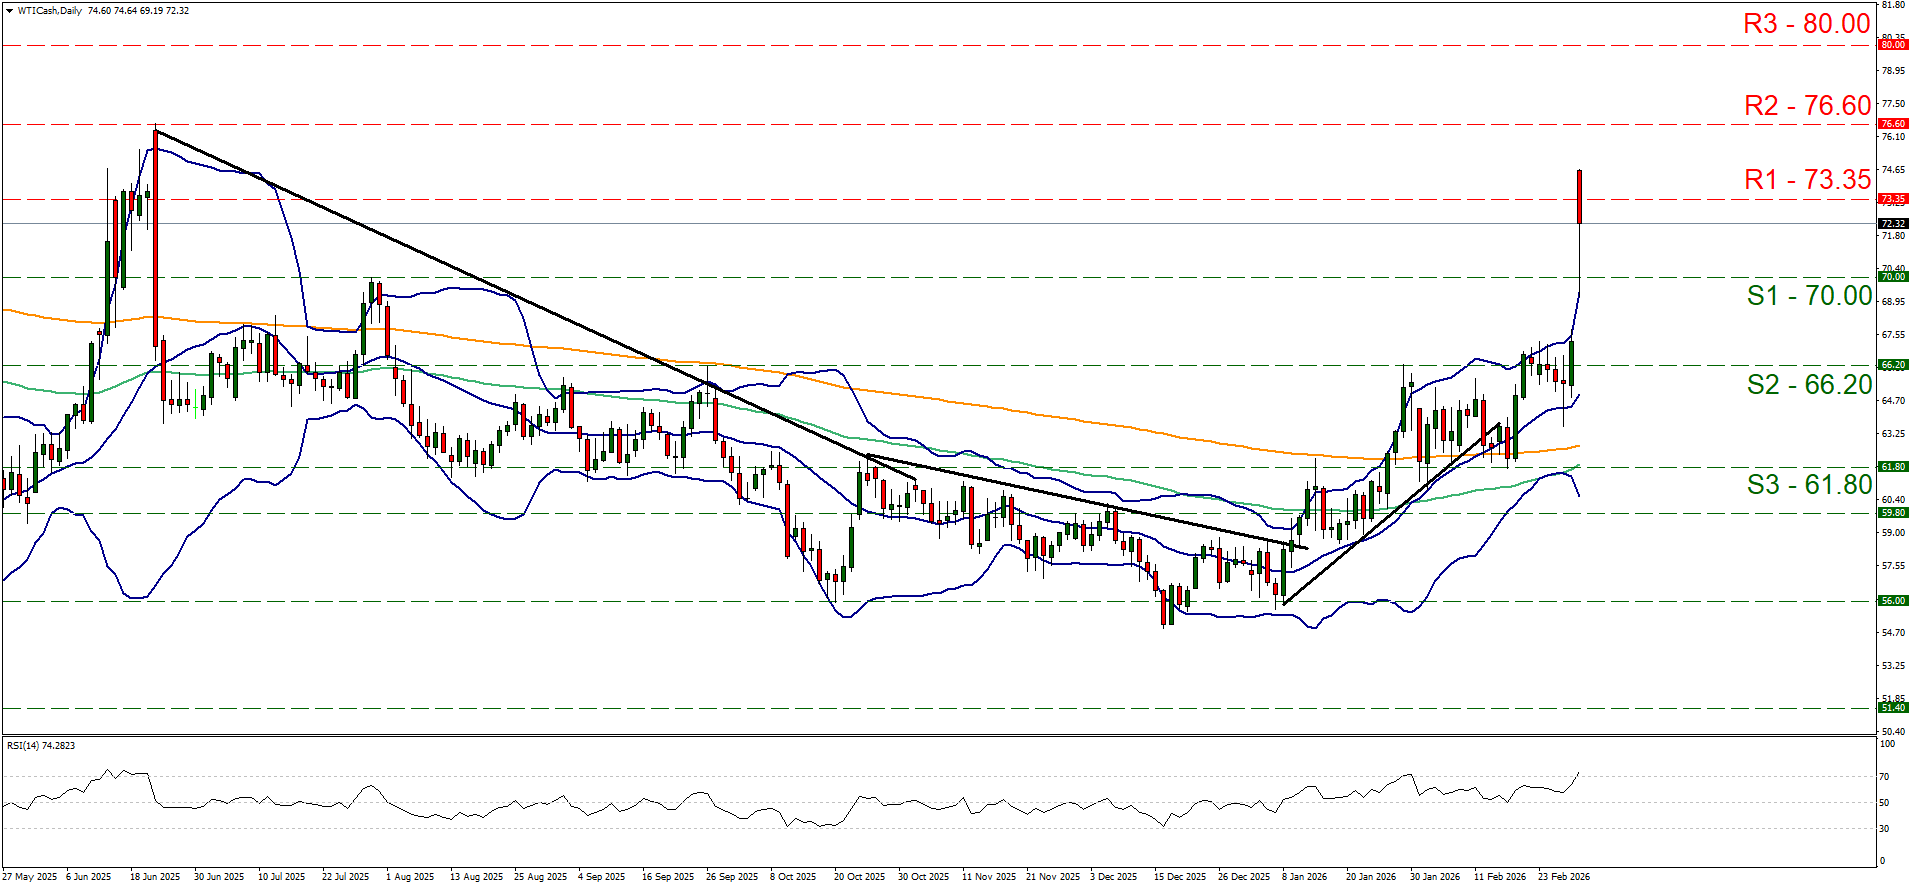
- Support: 70.00 (S1), 66.20 (S2), 61.80 (S3).
- Resistance: 73.35 (R1), 76.60 (R2), 80.00 (R3).
USD/JPY daily chart
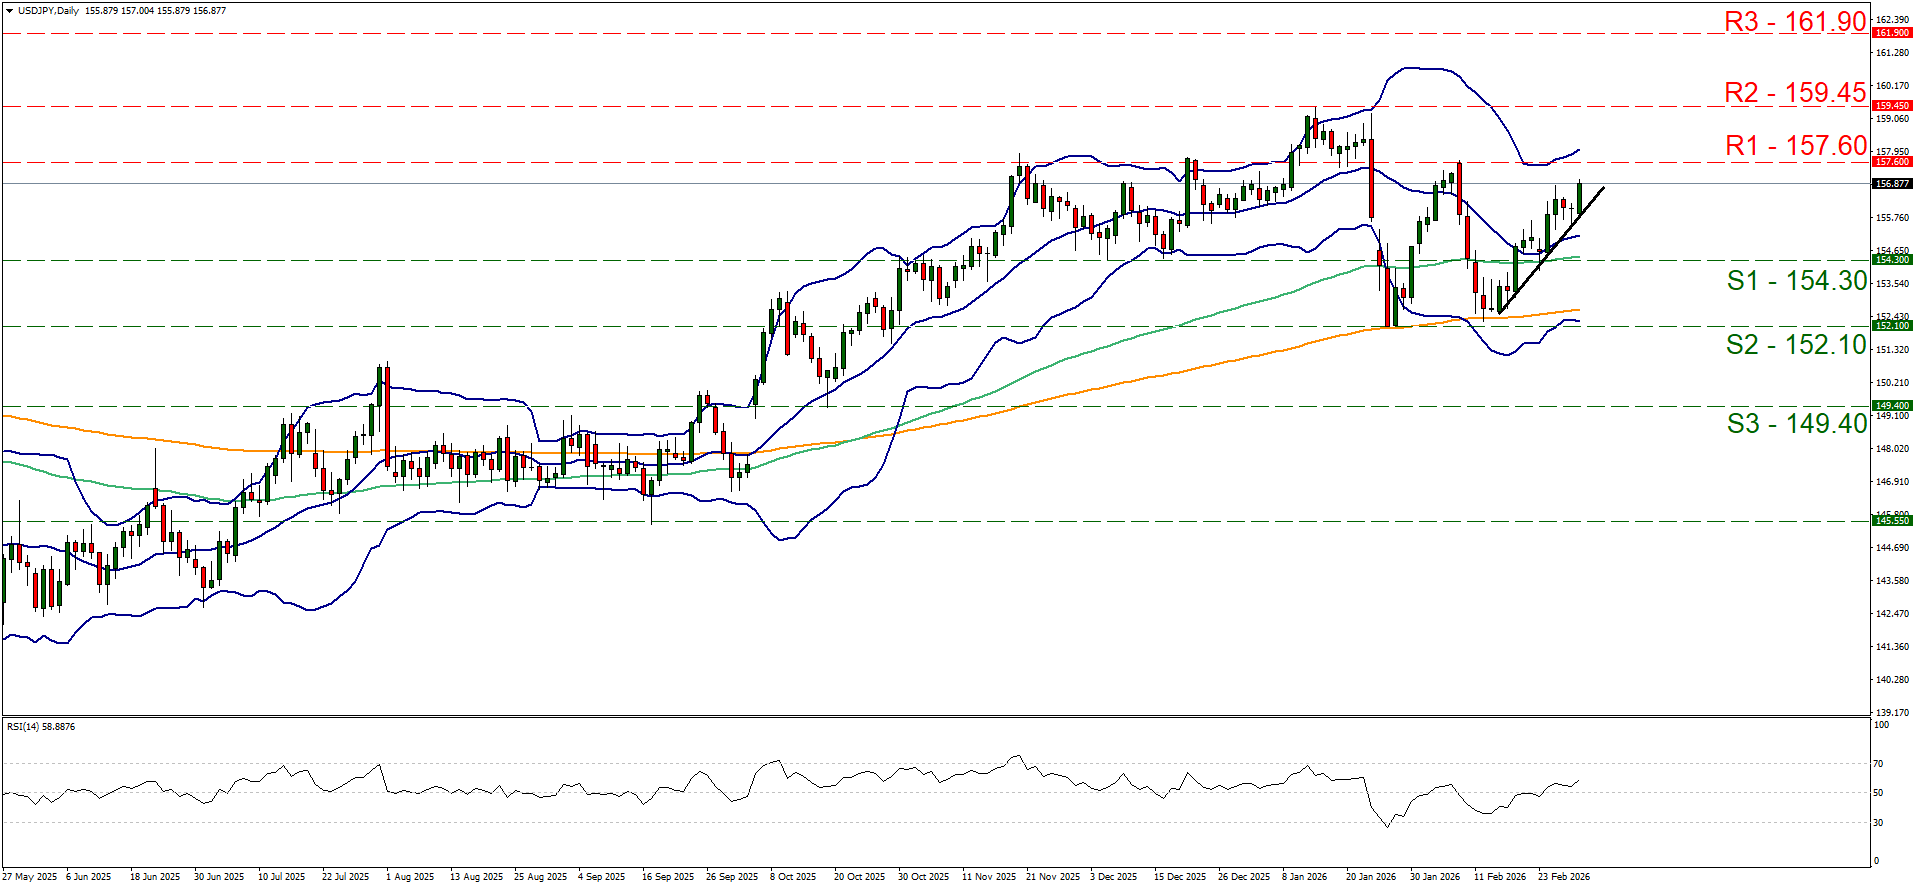
- Support: 154.30 (S1), 152.10 (S2), 149.40 (S3).
- Resistance: 157.60 (R1), 159.45 (R2), 161.90 (R3).
Author

Peter Iosif, ACA, MBA
IronFX
Mr. Iosif joined IronFX in 2017 as part of the sales force. His high level of competence and expertise enabled him to climb up the company ladder quickly and move to the IronFX Strategy team as a Research Analyst. Mr.


