US$ index, further near term upside limited?

Nearer term $ index outlook :
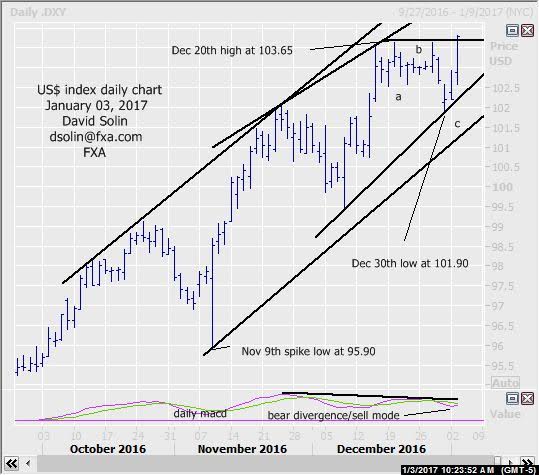
The market is consolidating from the Dec 20th high at 103.65 with the 3 wave action from that peak (a-b-c) suggesting a correction, with new highs after. But be warned, the magnitude of further near term gains is a question given lots of bigger picture negatives. They include deteriorating technicals (see bear divergence, sell mode on the daily macd) an overbought market after the last few months of gains and slowing upside momentum, with all suggesting a rising risk of a top for at least a month or 2 (within the longer term uptrend, see longer term below). Further resistance is just above that 103.65/80 high in the whole 104.35/75 area (both the longer term ceiling of the bullish channel from May 2011 and the rising trendline from late Nov). Nearby support is seen at the bullish trendline from Dec 8th (currently at 102.05/20). Bottom line : new highs above 103.65 favored, but the magnitude is a question and may be more limited, part of a larger topping (and versus the start of a more major, new upleg).
Strategy/position:
Though there is scope for further near term upside, just not seen as a good risk/reward in chasing from here given with the potentially limited upside (and rising potential of a top for at least a month or 2). So would await a better risk/reward entry ahead.
Long term outlook:
Longer term bullish view since May remains in place as the upside pattern from the May 3rd low at 91.90 is still not "complete" (currently within wave 3), while long term technicals remain bullish (see buy mode on the weekly macd). As mentioned above, there is rising potential of a top for at least a month or 2, would likely be an extended period of sloppy ranging with good sized swings in both directions (wave 4) and with a resumption the longer term gains after (within wave 5, see "ideal" scenario in red on weekly chart/2nd chart below). But remember, this is the "ideal" scenario and there is still no confirmation of that nearer term top so far. Bottom line : long term bullish view since May remains but with rising potential for a few months of consolidating the larger uptrend.
Strategy/position:
Despite remaining a longer term bull, too much rising risk of a few months of consolidating to bullish here (not a good overall risk/reward).
|
Current: Near term : short Dec 5th at 100.10, stopped Dec 15 above t-line from Nov (101.70, closed 103.00). Last : long Aug 24 at 94.75, took prof Oct 28 below month long t-line (98.65, closed 98.35, 360 ticks).
Longer term : same as shorter term above as the market did not range as long as expected. Last: : bull bias Aug 24th at 94.75 to neutral Oct 28th at 98.35. |
Author

David Solin
FXA


