US household wealth fell $6.1tn in the second quarter

The hefty falls in equity markets through the first half 2022 have put quite a dent in household wealth, but we have to remember strong gains over the past two years means it is still up $27tn on pre-pandemic levels to currently stand at $144tn. This will provide a strong platform for the consumers to withstand intensifying economic headwinds.

Falling stock prices hit household wealth
The US economy and jobs market have rebounded strongly over the past couple of years, recovering all output and jobs lost during the pandemic. Asset markets performed even better. House prices nationally are up more than 40% on pre-pandemic levels while the S&P500, even after recent declines, is up around 20% from that same point and is up more than 80% on its 23rd March 2020 low.
Nonetheless, the technical recession through the first half of the year and worries about the outlook for growth and corporate profits has seen stock prices come under pressure of late. It was this, in combination with an increase in mortgage debt that led to a $6.1 trillion decline in household wealth in the second quarter.
The value of financial assets held by the household sector fell $7.3tn. $6.7tn of the drop was in directly held corporate equities and mutual fund shares with a further $1.3tn stripped from the valuation of pension and insurance funds. Wealth held in debt securities and non-corporate equities rose modestly while there was a slight $129bn drop in the holdings of cash, checking and time savings deposits.
Non-financial assets held by the household sector continue to grow, increasing $1.6tn in value in the quarter. This is primarily real estate, but also includes things such as cars, jewellery and equipment. Rounding out the balance sheet, liabilities increased by $363bn due to higher mortgage borrowing and consumer credit.
Cumulative change in household assets since 4Q 2019 $tn
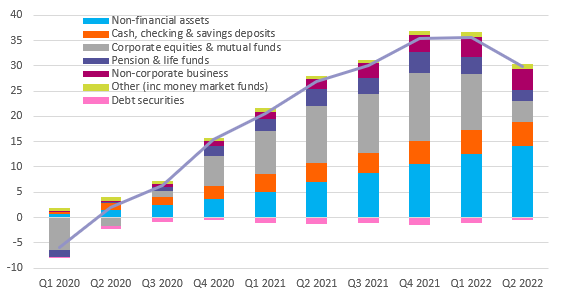
Source: Macrobond, ING
Household wealth is still up massively on pre-pandemic levels
While this decline in wealth isn’t exactly good news, it has to be set against the huge net $27tn gain in household wealth through the pandemic overall. Even after the second quarter decline, net worth stands at $144tn.
Massive fiscal and monetary stimulus – $5tn of direct payments to households via stimulus checks and extended and uprated unemployment benefits plus a further $5tn of quantitative easing played a huge part. So too did the involuntary saving caused by movement restrictions imposed during the pandemic. The result was that money that would have been spent on goods and services ended up being funneled into both financial and non-financial assets.
Assets & liabilities as a percentage of disposable income (1950-2022)
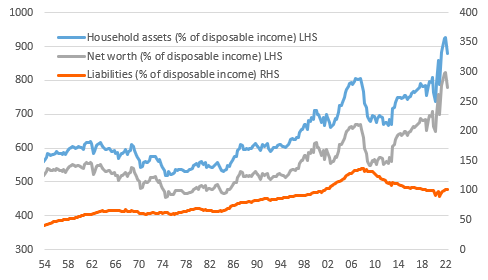
Source: Macrobond, ING
Strong balance sheets will help the US weather the economic storm
With recessionary forces intensifying both externally through the European energy crunch and weaker Chinese activity, and domestically via higher interest rates, a strong dollar and a softening housing market, the consumer will play a huge role in how prolonged and deep any downturn will be. Thankfully the jobs market remains strong with more than two job vacancies for every unemployed American while today’s wealth numbers suggested the household sector is in a fundamentally strong position – cash balances look particularly good.
As a proportion of disposable incomes, household assets are 880% while liabilities are ‘just” 102%. This is a much better position than any previous recessionary environment and means that the consumer sector should be better able to withstand intensifying economic headwinds. Consequently we remain hopeful that a likely 2023 recession will be modest and short lived assuming a swift easing of monetary policy from the Federal Reserve.
Read the original analysis: US household wealth fell $6.1tn in the second quarter
Author

James Knightley
ING Economic and Financial Analysis
James Knightley is the Chief International Economist in London. He joined the firm in 1998 and has been covering G7 and Western European economies. He studied economics at Durham University, UK.


