US consumer has a new lease on life

Summary
Look past the bland headline income and spending number for August to find data revisions that put the consumer on firmer footing. Income and spending are now stronger and households have been stashing away a bit more savings than previously thought.
Revisions: How the consumer got her groove back
The real news in today's personal income and spending report is less about the specific details of how consumer finances fared in August and much more about how U.S. households are suddenly on much firmer footing in light of recent revisions.
There are multiple revisions reflected in today's numbers, some of which change past data all the way back to the start of 2019 and some are just a truing up of the latest income figures in light of first-quarter wage data from the Bureau of Labor Statistics.
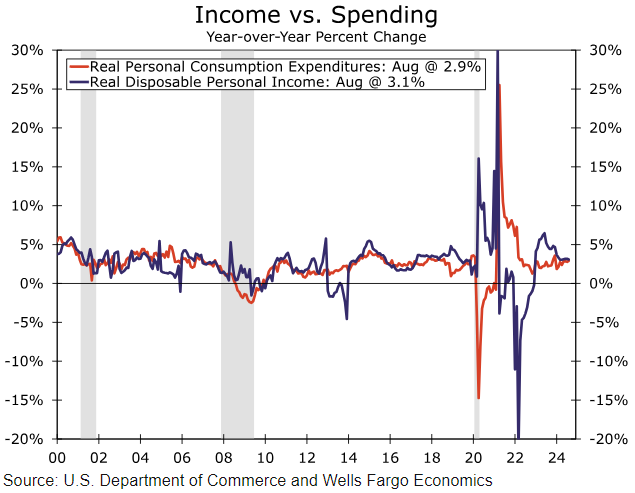
If it ever felt like the consumer spending numbers this year were too good to be true, brace yourself...real PCE was just revised UP every month of this year. In level terms real PCE for July is now 1.2% higher than previously reported. Real disposable income was revised higher as well and now looks more supportive of spending (chart).
This may feel at odds with the benchmark payroll revisions which erased more than 800K previously reported jobs, but there were downward revisions to 2023 wages. This is actually somewhat consistent with weaker signs from a quarterly census survey and the non-farm payroll revisions. The distant past looks worse, but the more recent past looks better as more recent wage data have benefited from upward revisions.
The upward income revision is about more than just higher employee compensation. All other components of income including proprietors' income, rental receipts, investment returns, jobless benefits and Medicare benefits were all revised higher.
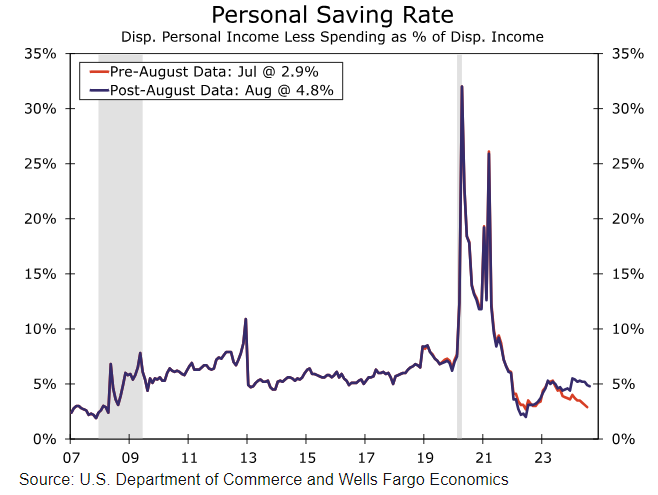
All told the consumer looks to be on sturdier footing. With upward revisions to income being greater than those to spending, the data now suggest households have been saving a bit more each month than previously thought. As seen in the nearby chart, the personal saving rate is now significantly higher at just under 5% rather than the south of 3% readings we had been seeing prior to today's revisions. This suggests households may have a bit more gas in the tank to support consumption.
In terms of third-quarter GDP growth implications, the data actually shake out to pose some modest downside risk to our estimate for real PCE growth to advance at a 3.5% annualized rate in Q3. Essentially stronger spending levels at the start of the year lifted previous quarters growth and weighed on Q2 and now Q3 estimates. That said, spending still looks to advance at around a 3% annualized rate in Q3, which is still consistent with a robust spending environment.
Inflation remains in check. The Fed's preferred measure of consumer price inflation, the PCE deflator, advanced 0.1% during the month at both a headline and core level. On a year-ago basis, the PCE deflator sits at 2.2%, and even as core price growth remains a bit firmer (2.7% year/year) the Fed is nearing the mark on inflation. These benign readings also give the Fed more cover to focus on the jobs market. Next week's nonfarm payroll report will be key for the Fed assessing labor market health. Our read from today's report is that growth, at least measured by consumption, remains robust. While not impossible, it's hard to square this strong consumer-demand environment with a labor market on the cusp of rapid deterioration.
Author

Wells Fargo Research Team
Wells Fargo


