US 100 cash index faces steep uptrend line after rejection at 21,450
-
US 100 cash index remains in positive territory.
-
But MACD and stochastic head lower.

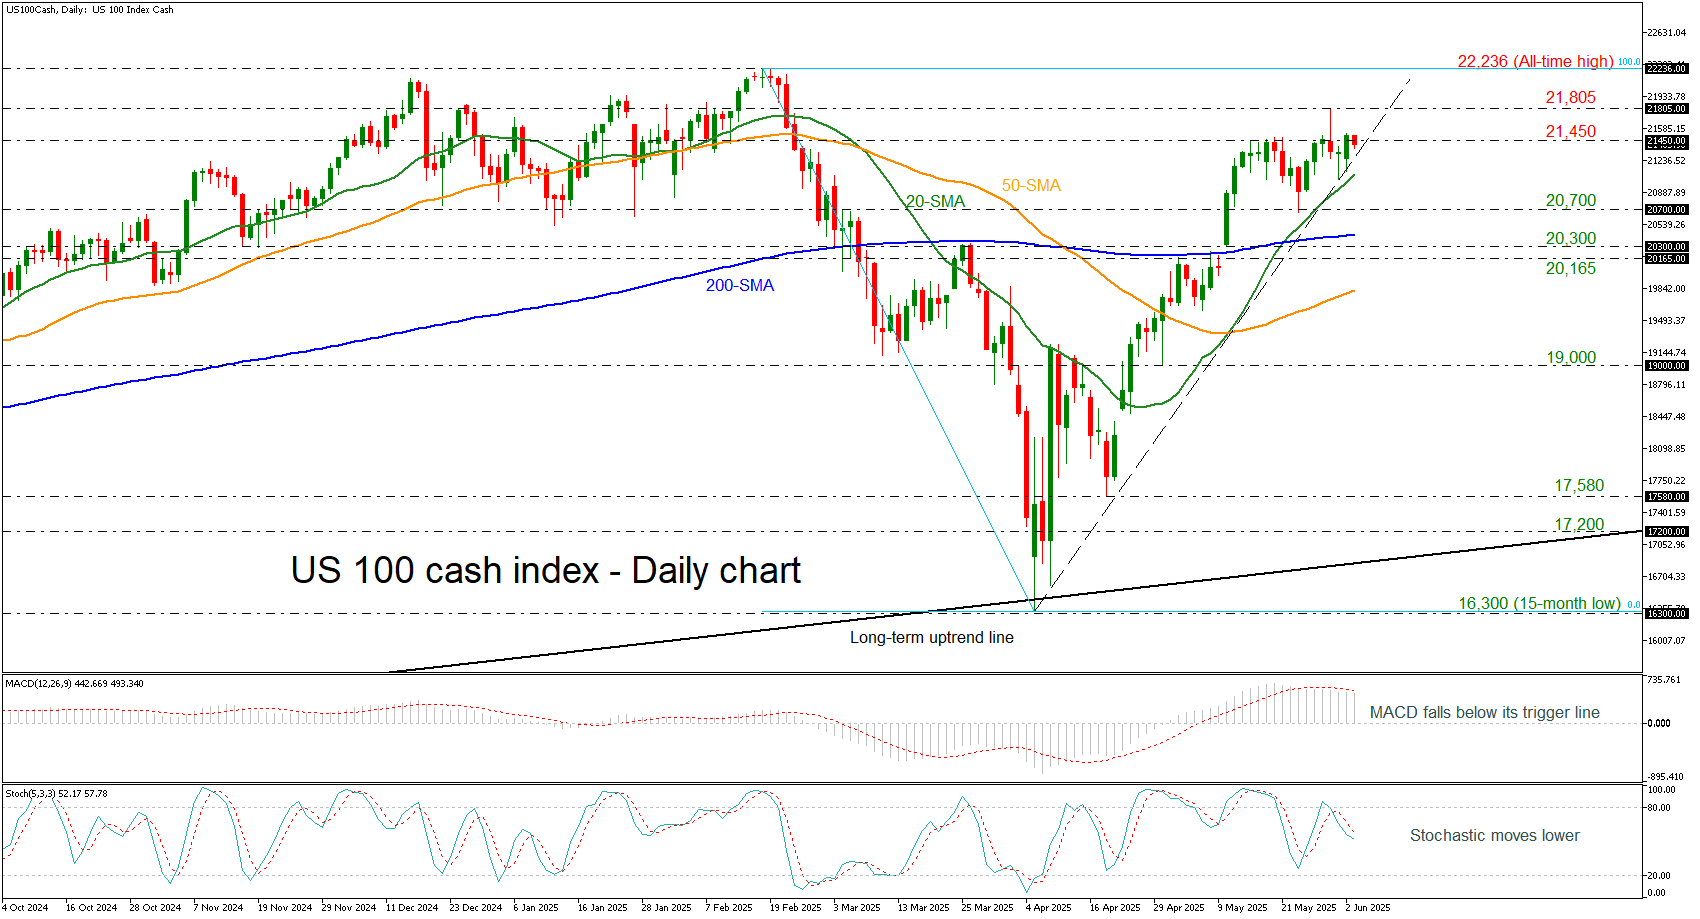
The US 100 cash index is once again retreating from the critical 21,450 resistance level, currently testing the steep short-term ascending trend line. A daily close above this line would likely reinvigorate bullish momentum, opening the door for a retest of the 21,805 recent high, with scope for an extension toward the all-time peak at 22,236.
Conversely, a decisive break below the rising trend line would neutralize the near-term bullish bias, exposing the index to downside risks. Initial support lies at the recent low of 20,700, followed by the 200-day simple moving average (SMA) at 20,430, and the broader support zone between 20,165 and 20,300.
From a technical standpoint, momentum indicators are showing signs of weakening. The MACD remains in positive territory but has slipped below its signal line, indicating a potential loss of upward momentum. Meanwhile, the stochastic oscillator is trending lower after exiting overbought conditions, reinforcing the short-term corrective tone.
The US 100 index has maintained a strong bullish structure since April 7 on the daily chart. However, a sustained move below the 19,000 psychological level would mark a shift toward a more cautious, slightly bearish near-term outlook.
Author

Melina joined XM in December 2017 as an Investment Analyst in the Research department. She can clearly communicate market action, particularly technical and chart pattern setups.


