Upside momentum: Fed speculation, key indicators

USD: Dec '23 is Down at 103.235.
Energies: Jan '24 Crude is Down at 77.55.
Financials: The Dec '23 30 Year T-Bond is Up 5 ticks and trading at 115.31.
Indices: The Dec '23 S&P 500 emini ES contract is 27 ticks Lower and trading at 4530.75
Gold: The Dec'23 Gold contract is trading Up at 1989.50.
Initial conclusion
This is not a correlated market. The USD is Down and Crude is Down which is not normal, but the 30 Year T-Bond is trading Higher. The Financials should always correlate with the US dollar such that if the dollar is Higher, then the bonds should follow and vice-versa. The S&P is Lower and Crude is trading Lower which is not correlated. Gold is trading Higher which is correlated with the US dollar trading Down. I tend to believe that Gold has an inverse relationship with the US Dollar as when the US Dollar is down, Gold tends to rise in value and vice-versa. Think of it as a seesaw, when one is up the other should be down. I point this out to you to make you aware that when we don't have a correlated market, it means something is wrong. As traders you need to be aware of this and proceed with your eyes wide open. Asia is trading mainly Lower with the exception of the Aussie and Sensex exchanges. Europe is trading mainly Lower with the exception of the German Dax and Spanish IBEX exchanges which are Higher at the present time.
Possible challenges to traders
-
Existing Home Sales is out at 10 AM EST. This is Major.
-
FOMC Meeting Minutes is out at 2 PM EST. This is Major.
Treasuries
Traders, please note that we've changed the Bond instrument from the 30 year (ZB) to the 10 year (ZN). They work exactly the same.
We've elected to switch gears a bit and show correlation between the 10-year bond (ZN) and the S&P futures contract. The S&P contract is the Standard and Poor's, and the purpose is to show reverse correlation between the two instruments. Remember it's likened to a seesaw, when up goes up the other should go down and vice versa. Today we aren't dealing with a correlated market and our bias is to the Upside.
Yesterday the ZN migrated Higher at around 7:30 AM EST as the S&P hit a High at around the same time. If you look at the charts below the S&P gave a signal at around 7:30 AM and the ZN started its Upward trend. Look at the charts below and you'll see a pattern for both assets. S&P hit a High at around 7:30 AM and migrated Higher. These charts represent the newest version of MultiCharts and I've changed the timeframe to a 15-minute chart to display better. This represented a Long opportunity on the 10-year note, as a trader you could have netted about 20 ticks per contract on this trade. Each tick is worth $15.625. Please note: the front month for the ZN is now Dec '23. The S&P contract is now Dec' 23. I've changed the format to filled Candlesticks (not hollow) such that it may be more apparent and visible.
Charts courtesy of MultiCharts built on an AMP platform
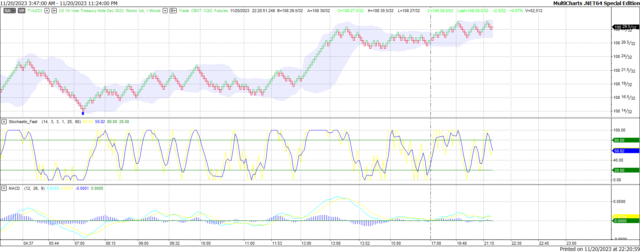
ZN - Dec 2023 - 11/20/23
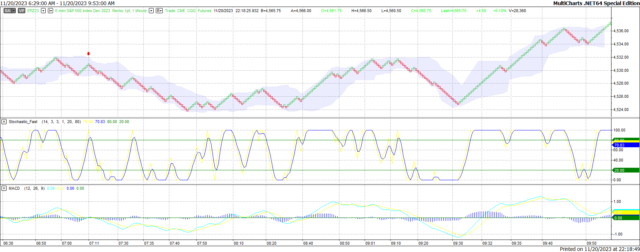
S&P - Dec 2023 - 11/20/23
Bias
Yesterday we gave the markets an Upside bias as both the USD and the Bonds were trading Lower and that usually reflects an Upside Day. The markets didn't disappoint as the Dow gained 204 points and the other indices traded Higher as well. Today we aren't dealing with a correlated market and our bias is Neutral or Mixed.
Could this change? Of Course. Remember anything can happen in a volatile market.
Commentary
Yesterday economic news did not take front and center as there was no real economic news to report. We concluded that the bias was to the upside based solely on our rules of Market Correlation which told us that the bias should be to the Upside. The markets didn't disappoint as the Dow closed Higher by over 200 points. Some analysts have started to say that the Fed is done raising rates. Please do not buy that rumor as no one knows what the Fed will do. Do I want them to Lower rates? Of course, I do as I believe it's good for the entire economy when capital is easier to acquire. Today we have Existing Home Sales and the FOMC Meeting Minutes, both of which are major.
Author

Nick Mastrandrea
Market Tea Leaves


