Uncertainty Following Monday's Rally, Will S&P 500 Continue Higher?

Briefly:
Intraday trade: Our yesterday's neutral intraday outlook has proved accurate. The stock market continued to move sideways, as investors hesitated following Monday's rally. In our opinion, the S&P 500 is likely to move lower today, as investors may continue to take profits off the table following economic data releases, among others. Therefore, intraday short position is favored. Stop-loss is at the level of 2,480 or 5 points above yesterday's daily high. Potential profit target is at 2,450 or 18 points below yesterday's closing price (S&P 500 index).
Our intraday outlook is bearish, and our short-term outlook is bearish, as we expect downward correction. Our medium-term outlook remains neutral:
Intraday outlook (next 24 hours): bearish
Short-term outlook (next 1-2 weeks): bearish
Medium-term outlook (next 1-3 months): neutral
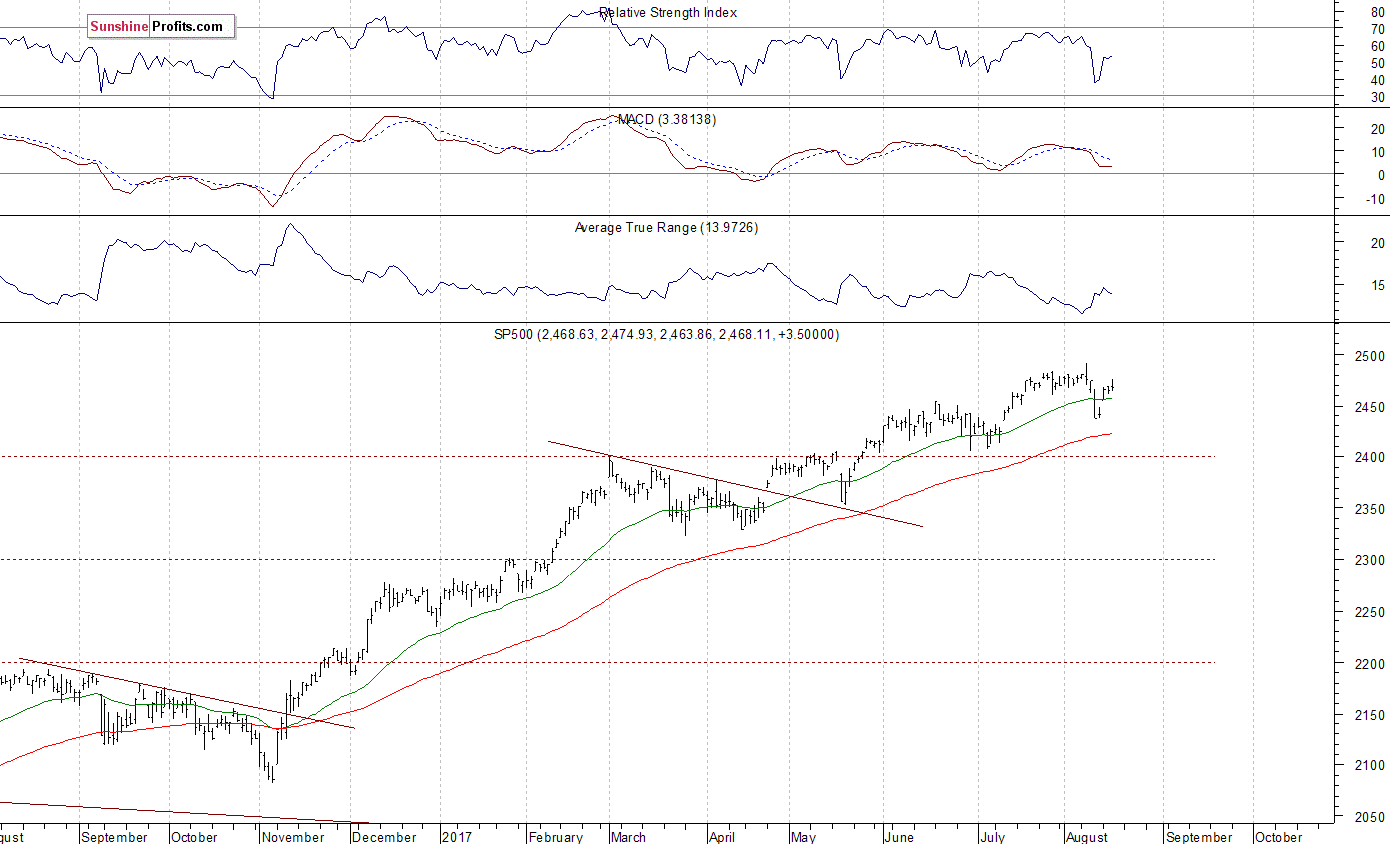
The main U.S. stock market indexes gained between 0.1% and 0.2% on Wednesday, extending their short-term fluctuations following Monday's rebound, as investors took short-term profits off the table. The S&P 500 index has reached new all-time high at the level of 2,490.87 last week. Then, it retraced most of its recent rally, as it fell below the level of 2,440. The broad stock market gauge broke below its few-week-long consolidation along new record high. However, it has managed to bounce back to that level on Monday, retracing the whole Thursday's sell-off. The Dow Jones Industrial Average trades above 22,000 mark again. The technology Nasdaq Composite gained 0.2% yesterday, as it retraced some more of its recent move down. The nearest important level of resistance of the S&P 500 index is at around 2,465-2,475, marked by previous level of support and local highs. The next resistance level is at 2,490-2,500, marked by record high. On the other hand, support level is at around 2,450-2,455, marked by Monday's daily gap up of 2,448.09-2,454.96, among others. The next support level remains at 2,435-2,440, marked by last week's local lows. The support level is also at around 2,430-2,435, marked by July 12 daily gap up of 2,429.30-2,435.75. Will uptrend resume? Or is this just a strong rebound following recent decline? The market may be forming some medium-term topping pattern. It trades within month-long consolidation, as we can see on the daily chart:
S&P 500 May Open Lower
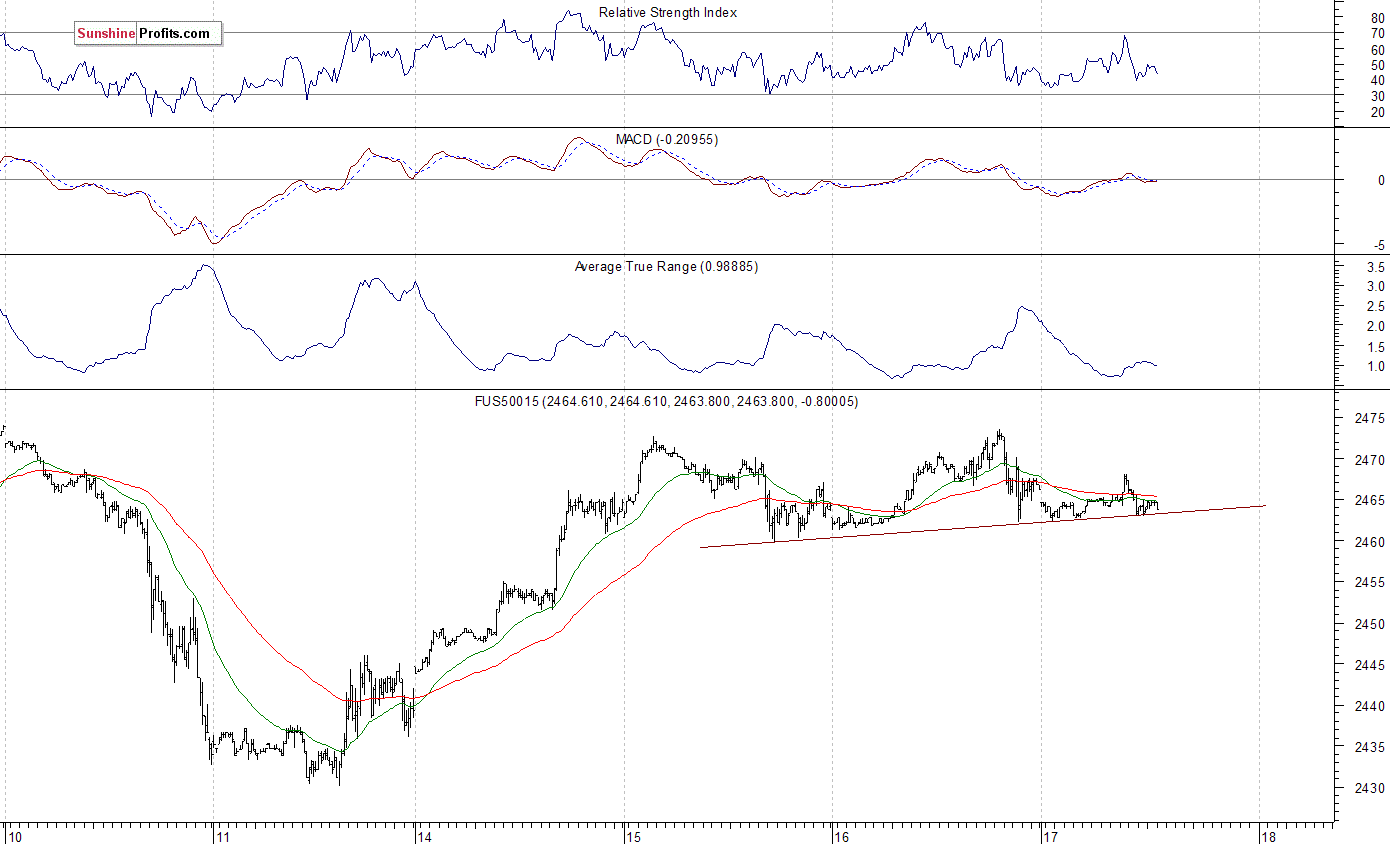
Expectations before the opening of today's trading session are slightly negative, with index futures currently down 0.1-0.3% vs. their Wednesday's closing prices. The European stock market indexes have lost 0.2-0.4% so far. Investors will now wait for some economic data announcements: Initial Claims, Philadelphia Fed Index at 8:30 a.m., Industrial Production, Capacity Utilization at 9:15 a.m., Leading Index at 10:00 a.m. The market expects that Industrial Production grew 0.3% in July, and Initial Claims were at 240,000 last week. The S&P 500 futures contract trades within an intraday consolidation, as it extends its fluctuations following yesterday's intraday move down. For now, it looks like a relatively flat correction within a short-term uptrend off last week's local low. The nearest important level of resistance is at around 2,470-2,475, marked by recent local highs. The next resistance level is at 2,480-2,490, marked by record high. On the other hand, support level remains at around 2,460, marked by short-term consolidation. The next level of support remains at 2,445-2,450. The support level is also at 2,430, marked by recent local low. Will the market break above its short-term consolidation? Or is this some topping pattern before another leg down?
Tech Stocks Fluctuate
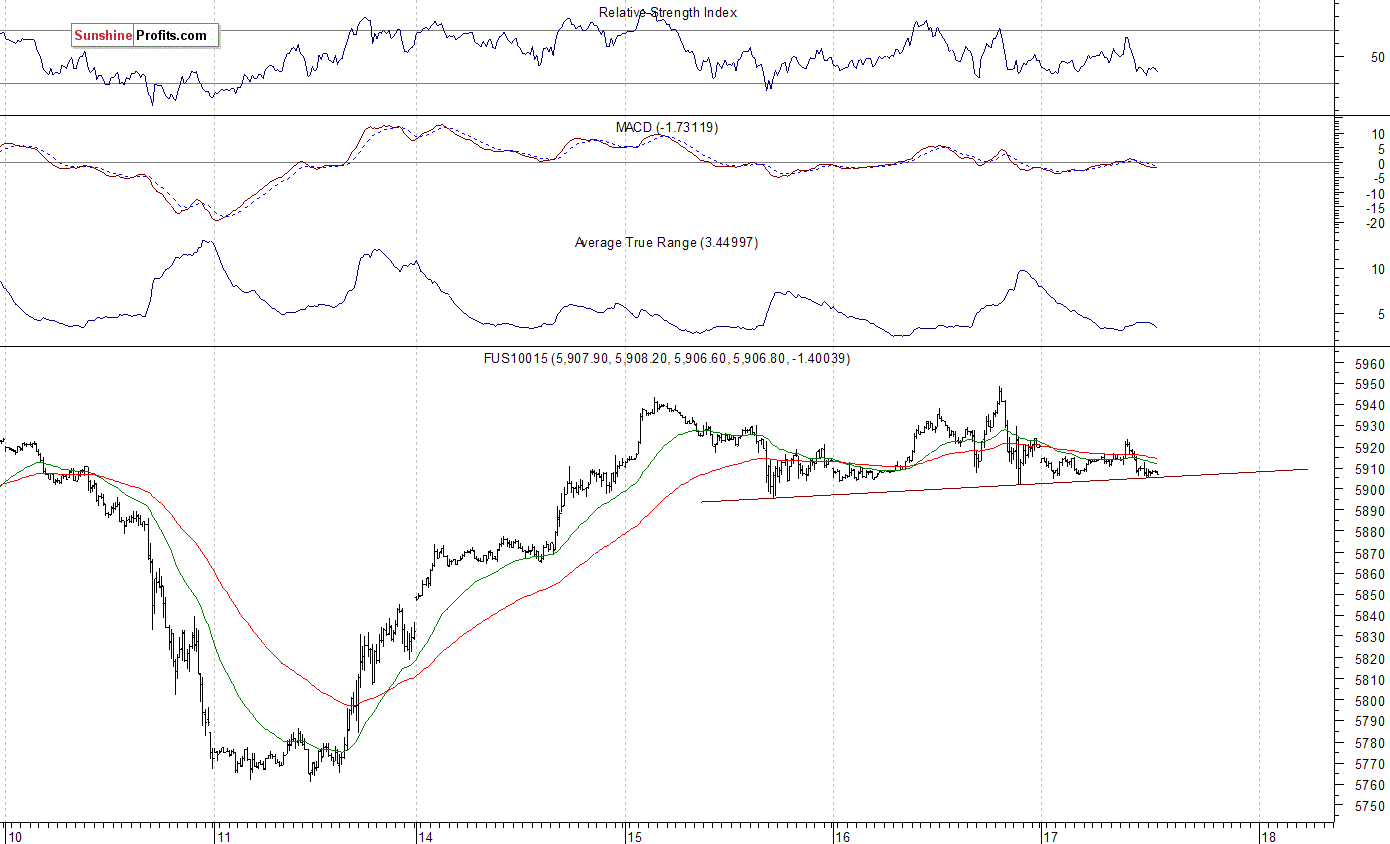
The technology Nasdaq 100 futures contract follows a similar path, as it fluctuates after yesterday's intraday move down. There have been no confirmed negative signals so far. The nearest important resistance level is at around 5,930-5,950, marked by short-term local highs. On the other hand, support level is at 5,900, marked by previous short-term resistance level. The next support level is at 5,850-5,870, among others, as the 15-minute chart shows:
Concluding, the S&P 500 index extended its short-term consolidation yesterday, as the broad stock market fluctuated following Monday's rally. Investors continued to take profits off the table. Will uptrend continue? Or is this some topping pattern before another leg lower? There have been no confirmed negative signals so far. However, we still can see medium-term overbought conditions along with negative technical divergences.
Want free follow-ups to the above article and details not available to 99%+ investors? Sign up to our free newsletter today!
Author

Paul Rejczak
Sunshine Profits
Paul Rejczak is a stock market strategist who has been known for the quality of his technical and fundamental analysis since the late nineties.


