Twas the day before Christmas [Video]
![Twas the day before Christmas [Video]](https://editorial.fxstreet.com/images/Macroeconomics/Events/Christmas/christmas-fireplace-family-hanging-socks-xmas-lights-decoration-tree-branches-77388151_XtraLarge.jpg)
US Dollar: Mar '23 USD is Down at 103,685.
Energies: Feb '23 Crude is Up at 80.36.
Financials: The Mar '23 30 Year T-Bond is Down 16 ticks and trading at 126.21.
Indices: The Mar '23 S&P 500 Emini ES contract is 103 ticks Higher and trading at 3895.50.
Gold: The Feb'23 Gold contract is trading Up at 1817.30. Gold is 131 ticks Higher than its close.
Initial conclusion
This is a nearly correlated market. The dollar is Down, and Crude is Up which is normal, and the 30 Year T-Bond is trading Lower. The Financials should always correlate with the US dollar such that if the dollar is lower, then the bonds should follow and vice-versa. The S&P is Higher, and Crude is trading Higher which is not correlated. Gold is trading Higher which is correlated with the US dollar trading Down. I tend to believe that Gold has an inverse relationship with the US Dollar as when the US Dollar is down, Gold tends to rise in value and vice-versa. Think of it as a seesaw, when one is up the other should be down. I point this out to you to make you aware that when we don't have a correlated market, it means something is wrong. As traders you need to be aware of this and proceed with your eyes wide open. Currently Asia is trading mainly Higher with the exception of the Hang Seng exchange. All of Europe is trading Higher.
Possible challenges to traders today
-
Goods Trade Balance is out at 8:30 AM EST. This is Major.
-
Prelim Wholesale Inventories is out at 8:30 AM EST. Major.
-
HPI m/m is out at 9 AM EST. This is Major.
-
S&P/CS Composite-20 HPI is out at 9 AM EST. This is Major.
Treasuries
Traders, please note that we've changed the Bond instrument from the 30 year (ZB) to the 10 year (ZN). They work exactly the same.
We've elected to switch gears a bit and show correlation between the 10-year bond (ZN) and the S&P futures contract. The S&P contract is the Standard and Poor's, and the purpose is to show reverse correlation between the two instruments. Remember it's likened to a seesaw, when up goes up the other should go down and vice versa.
Last Friday the ZN hit a High at around 8:15 AM EST. The S&P was trading Higher at around the same time. If you look at the charts below ZN gave a signal at around 8:15 AM and the S&P gave a signal at around the same time. Look at the charts below and you'll see a pattern for both assets. ZN hit a High at around 8:15 AM and migrated Higher. These charts represent the newest version of MultiCharts and I've changed the timeframe to a 15-minute chart to display better. This represented a Shorting opportunity on the 10-year note, as a trader you could have netted about 15 ticks per contract on this trade. Each tick is worth $15.625. Please note: the front month for the ZN is now Mar '23. The S&P contract is now Mar' 23 as well. I've changed the format to Renko Bars such that it may be more apparent and visible.
Charts courtesy of MultiCharts built on an AMP platform
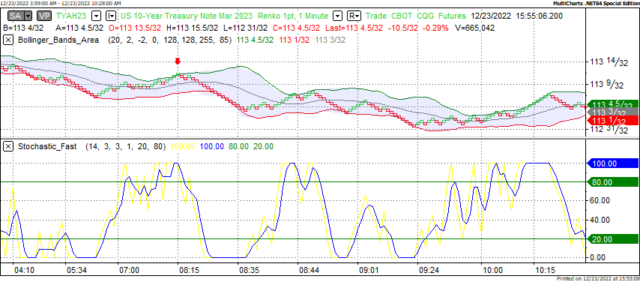
ZN - Mar 2023 - 12/23/22
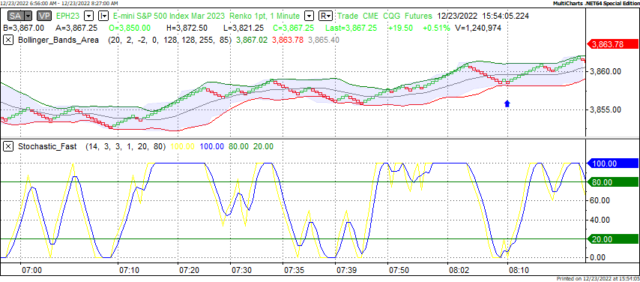
S&P - Dec 2022 - 12/23/22
Bias
Last Friday we gave the markets an Upside bias as both the USD and the Bonds were trading Lower Friday morning, and this usually represents an Upside Day. The markets didn't disappoint as the Dow traded Higher by 176 points Friday and the other indices traded Higher as well. Today we are dealing with a mainly correlated market and our bias is to the Upside.
Could this change? Of Course. Remember anything can happen in a volatile market.
Commentary
Well, it appeared as though the markets did have some semblance of the Christmas spirit last Friday as the indices closed Higher. Finally. I wouldn't call it a Santa Claus Rally, but the markets did close Higher. Today we have Home Price Increase numbers and given that these reports are real estate related, they are major and proven market movers. Will the Upswing continue? Only time will tell...
Author

Nick Mastrandrea
Market Tea Leaves


