Trump talk propels markets

USD: Mar '26 is Up at 97.690.
Energies: Apr '26 Crude is Down at 64.39.
Financials: The Mar '26 30 Year T-Bond is Lower by 2 ticks and trading at 117.13.
Indices: The Mar '26 S&P 500 emini ES contract is 3 ticks Lower and trading at 6959.00.
Gold: The Apr'26 Gold contract is trading Down at 5179.20.
Initial conclusion
This is not a correlated market. The USD is Up and Crude is Down which is normal, but the 30 Year T-Bond is trading Lower. The Financials should always correlate with the US dollar such that if the dollar is Higher, then the bonds should follow and vice-versa. The S&P is fractionally Lower and Crude is trading Lower which is not correlated. Gold is trading Lower which is correlated with the US dollar trading Up. I tend to believe that Gold has an inverse relationship with the US Dollar as when the US Dollar is down, Gold tends to rise in value and vice-versa. Think of it as a seesaw, when one is up the other should be down. I point this out to you to make you aware that when we don't have a correlated market, it means something is wrong. As traders you need to be aware of this and proceed with your eyes wide open. Asia traded Mixed with half the exchanges Higher and the other half Lower. Currently all of Europe is trading Higher.
Possible challenges to traders
- Unemployment Claims is out at 8:30 AM EST. This is Major.
- FOMC Member Bowman Speaks at 10 AM EST. This is Major.
- Natural Gas Storage is out at 10:30 AM EST. This is Major.
Traders, please note that we've changed the Bond instrument from the 10 Year (ZN) to the 2 Year (ZT). They work exactly the same.
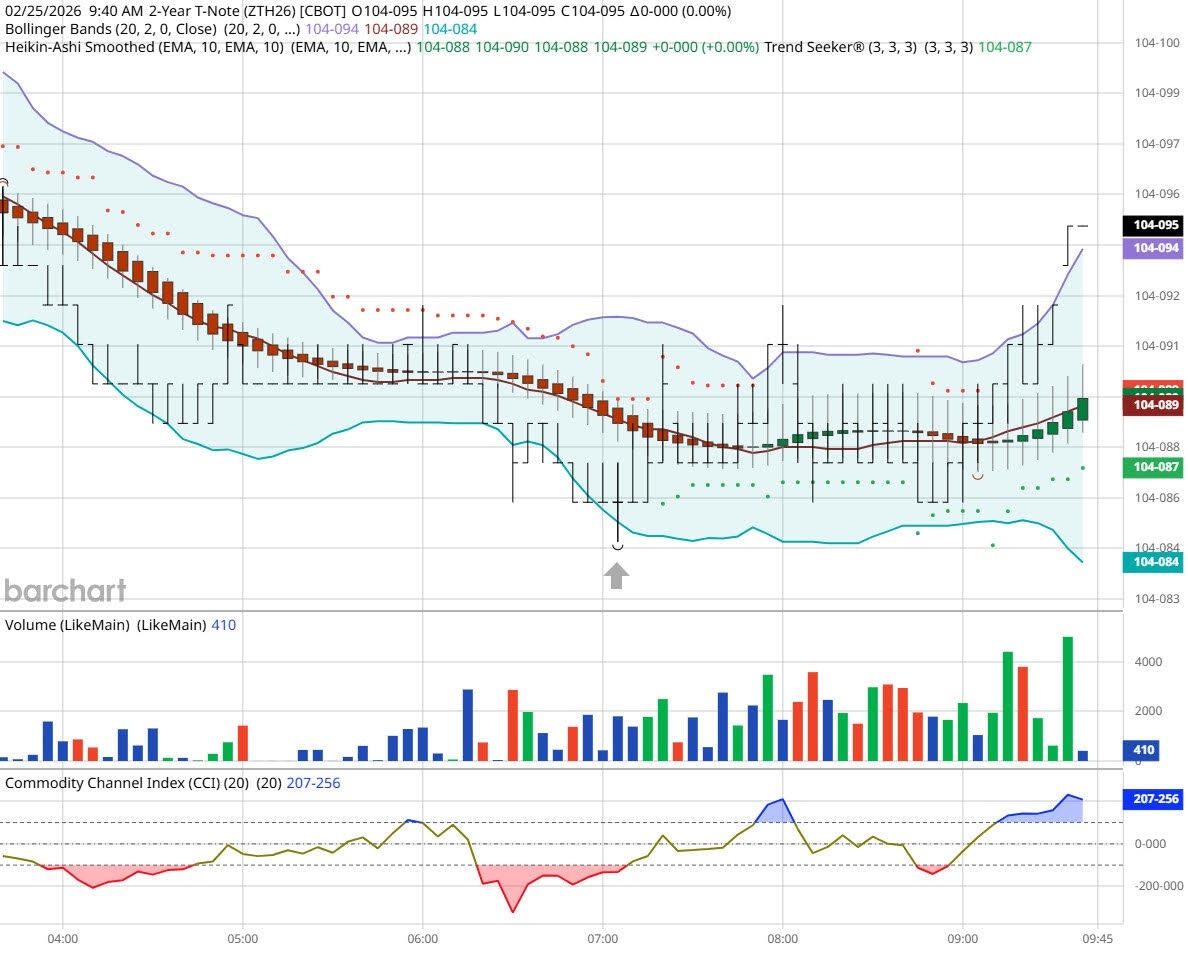
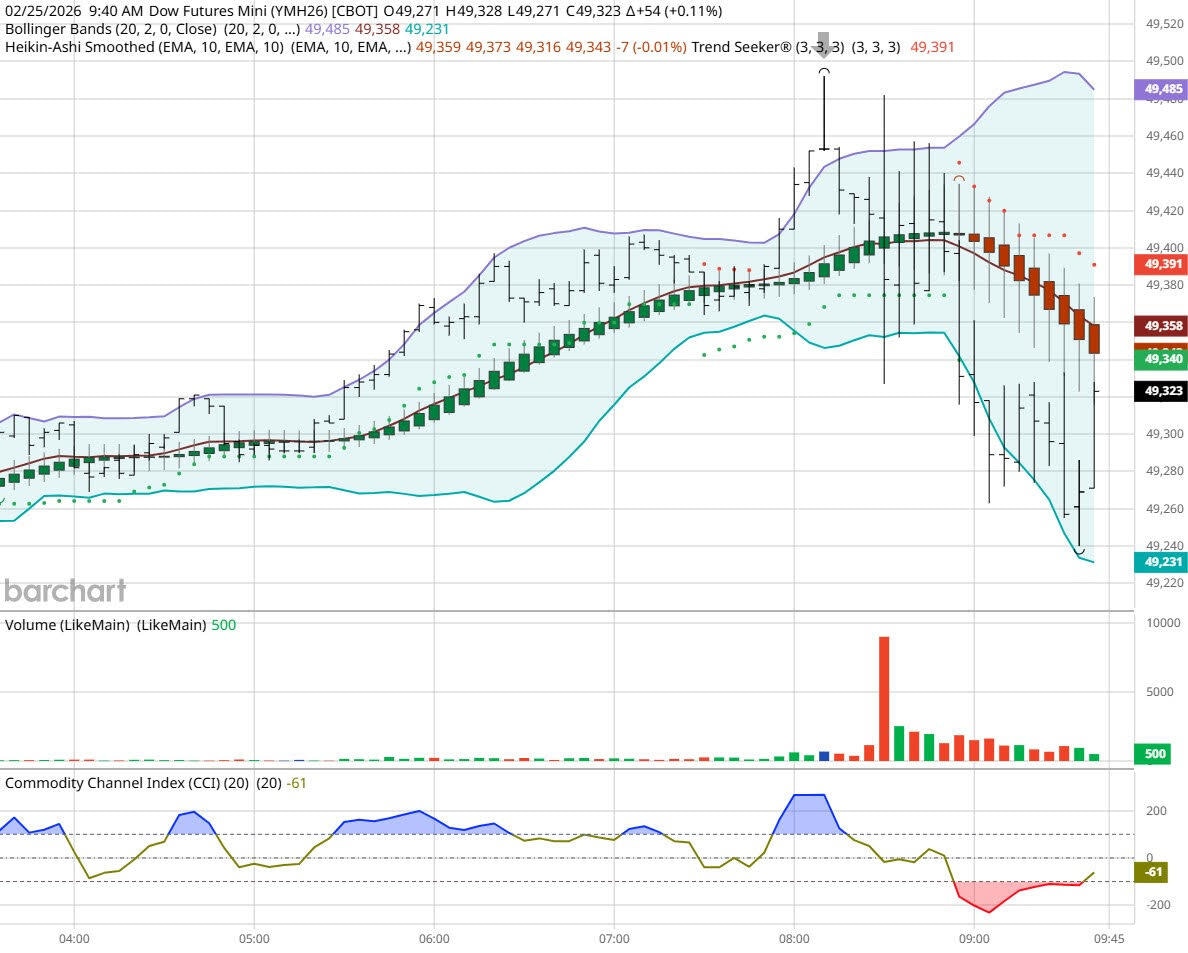
We've elected to switch gears a bit and show correlation between the 2-year Treasury notes (ZT) and the S&P futures contract. The YM contract is the Dow Jones Industrial Average, and the purpose is to show reverse correlation between the two instruments. Remember it's likened to a seesaw, when up goes up the other should go down and vice versa.
Yesterday the ZT climbed Higher at around 8 AM EST with no economic news report pending. The Dow dived Lower at around the same time. Look at the charts below and you'll see a pattern for both assets. The ZT climbed Higher at around 8 AM EST and the Dow dived Lower at around the same time. These charts represent the newest version of Bar Charts, and I've changed the timeframe to a 15-minute chart to display better. This represented a Long opportunity on the 2-year note, as a trader you could have netted about a dozen ticks per contract on this trade. Each tick is worth $6.25. Please note: the front month for the ZT and YM are both Mar '26. I've changed the format to filled Candlesticks (not hollow) such that it may be more apparent and visible.
Charts courtesy of barcharts
Bias
Yesterday we gave the markets an Upside bias and the markets didn't disappoint. The Dow climbed Higher by 284 points, and the other indices gained ground as well. Today we aren't dealing with a correlated market, and our bias is Mixed or Neutral.
Could this change? Of Course. Remember anything can happen in a volatile market.
Commentary
Yesterday the markets rose and all the news outlet talked about the SOTU address on Tuesday evening. I have no idea as to why Trump's address had anything to do with the markets rising as he didn't really say anything new or anything that he hasn't talked about prior.
Author

Nick Mastrandrea
Market Tea Leaves


