Trump/Kim sign an accord, markets breathe a sigh of relief
Market Overview
The initial suggestions coming out of the Trump/Kim summit in Singapore are that the meeting has gone well, and financial markets are breathing a sigh of relief. Whilst clearly there is time for Donald Trump to throw a spanner in the works, the inaugural meeting of leaders from the US and North Korea appears to have been constructive. Signing a “very comprehensive” accord is a good start, whilst the North Koreans have pledged a move towards complete “denuclearization”, although we are yet to know the details and exactly what this means. North Korea has promised denuclearization before, yet nothing came of it. However certainly this is a time for positives. The issue for the G7 at the weekend is that the whole concept of multi-lateral trade agreements is against what Donald Trump believes in, and so he sought to scupper the meeting. However, the maverick narcissist US President would just love to be lauded for being the one that brings a despot such as Kim Jong Un into the international fold. Quite what the meeting will achieve in the long term is yet to be seen, but anything that helps to reduce geopolitical risk in the emerging Asia region which has been a hub for such considerable economic growth during the recovery, can only help to improve risk appetite. Subsequently we are seeing positive risk through rising Treasury yields, forex majors, gold weaker and equities higher. Away from Singapore, there is a packed economic calendar to drive volatility today, with US inflation and the start of the two day Federal Reserve meeting on the agenda, whilst UK wage growth and a key Brexit Parliamentary debate will also feature.

Wall Street showed little direction into the close with the S&P 500 +0.1% at 2784, whilst US futures are ticking slightly higher in early moves. Asian markets have responded positively to events in Singapore with the Nikkei +0.5%, whilst European markets are also higher in early moves, with the DAX set to perform strongly. In forex, there is a push higher for the US dollar, whilst the yen is the main underperformer. The higher risk commodity currencies, the Aussie and Kiwi, are performing well. In commodities, the stronger dollar and positive risk environment is dragging gold lower, but not excessively so, only down by around $3; whilst oil is being supported by positive risk.
The meeting between Trump and Kim is undoubtedly the main even for traders, but there is also a packed economic calendar too. Starting with UK unemployment at 0930BST which is expected to stay at 4.2% again. However for the Bank of England, the UK wage data is far more important, with UK average weekly earnings expected to remain at +2.9% again on an ex-bonus year on year basis For the Eurozone, German ZEW Economic Sentiment is at 1000BST and is expected to deteriorate further to -14.0 (from -8.2 last month) which would be a third month in negative territory again the lower level since November 2012. The US CPI data is the most highly anticipated data release of the day at 1330BST which is expected to show headline CPI increasing to +2.7% (from +2.5% last month) whilst core CPI is expected to tick slightly higher to +2.2% (from +2.1% last month).
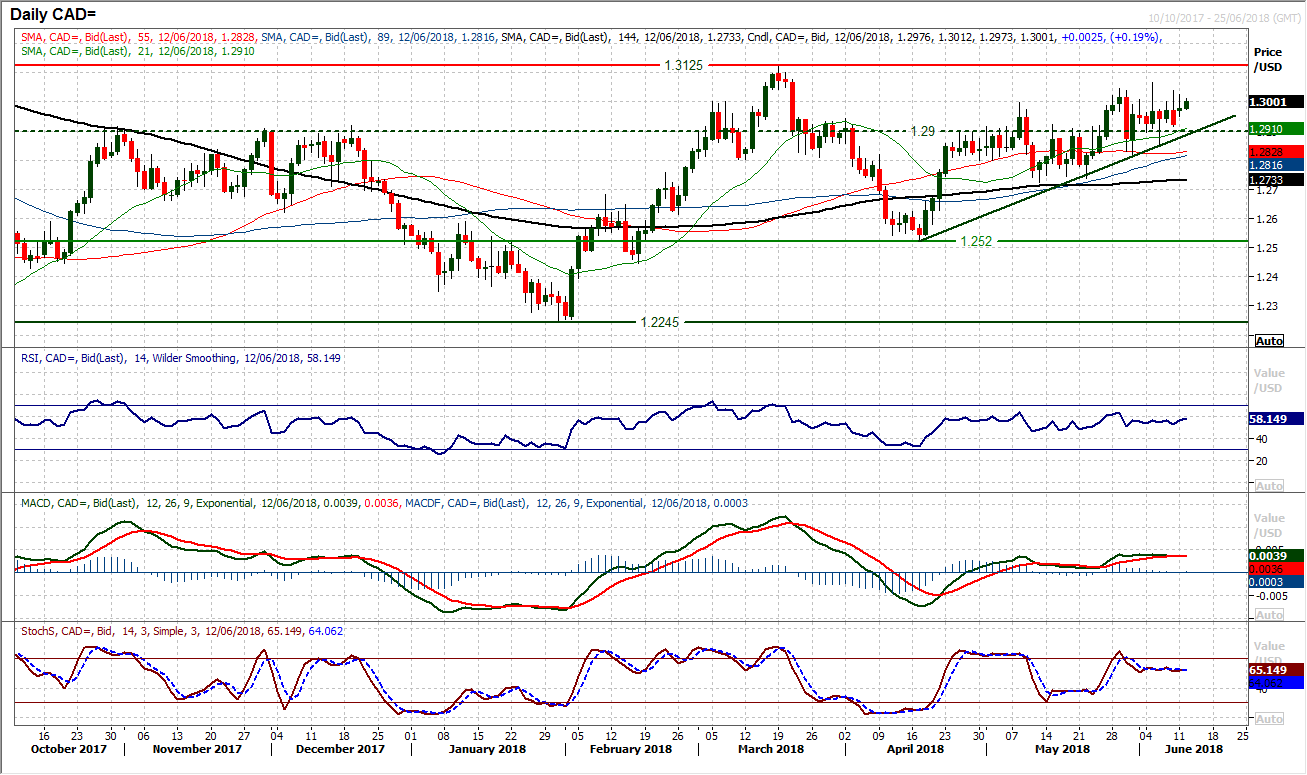
Chart of the Day – USD/CAD
The outlook for the Canadian dollar seems to be under pressure once more in the wake of the G7 but how has this impacted the technical outlook on USD/CAD? The uptrend that has been in place since the mid-April low at 1.2520, building with a sequence of higher lows and trading above all the rising moving averages, continues to reflect the ongoing improving outlook. There has been a pivot forming throughout much of this period at 1.2900 acting as a basis of support over the past week, and any corrective slip back towards the pivot is being used as a chance to buy. There is a positive bias to momentum configuration which suggests although there is no flood of buying pressure, the uptrend (that comes in around 1.2860 today) should continue to build. Tests above 1.3000 have struggled to maintain traction, with yesterday’s candle the latest one to pullback, however the bullish drift continues and a close above 1.3000 would begin to see the bulls gaining further confidence to tests higher and the March high of 1.3125 would come closer into view. Initial resistance is at 1.3040/1.3065. A breach of support at 1.2815 would shift the outlook to more corrective again.
EUR/USD
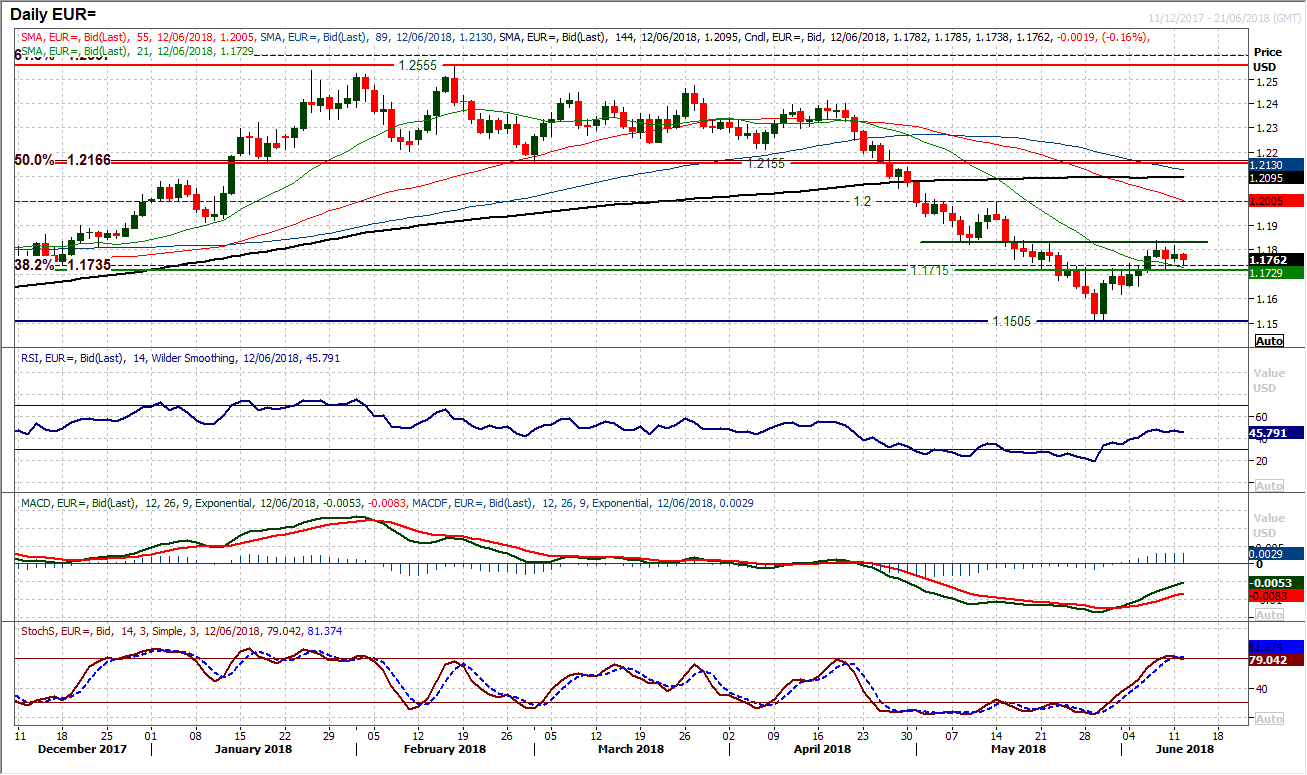
Markets have been consolidating in the past few sessions, with EUR/USD just unable to breakout above the growing pivot around $1.1820/$1.1840. This is just beginning to take some of the heat out of the rally, with the momentum indicators just tailing off a touch. The RSI is tailing in the mid-40s, whilst the Stochastics are rolling over around 80. The bulls will now need to work hard to prevent this recovery from being lost. That means holding on to the support band $1.1710/$1.1750 which is a clutch of near term highs that have been broken in the rebound and should now turn into an area of support. The hourly chart shows this support is holding during this phase of trading which is starting to look more ranging. Corrections of the past two weeks have broadly held on to the support of the rising 144 hour moving average (currently $1.1760). A move below $1.1725 would now begin to build a near term corrective move and form lower highs and lower lows. A move above $1.1820 would break the potential for a lower high. The bears are in control below $1.1640.
GBP/USD
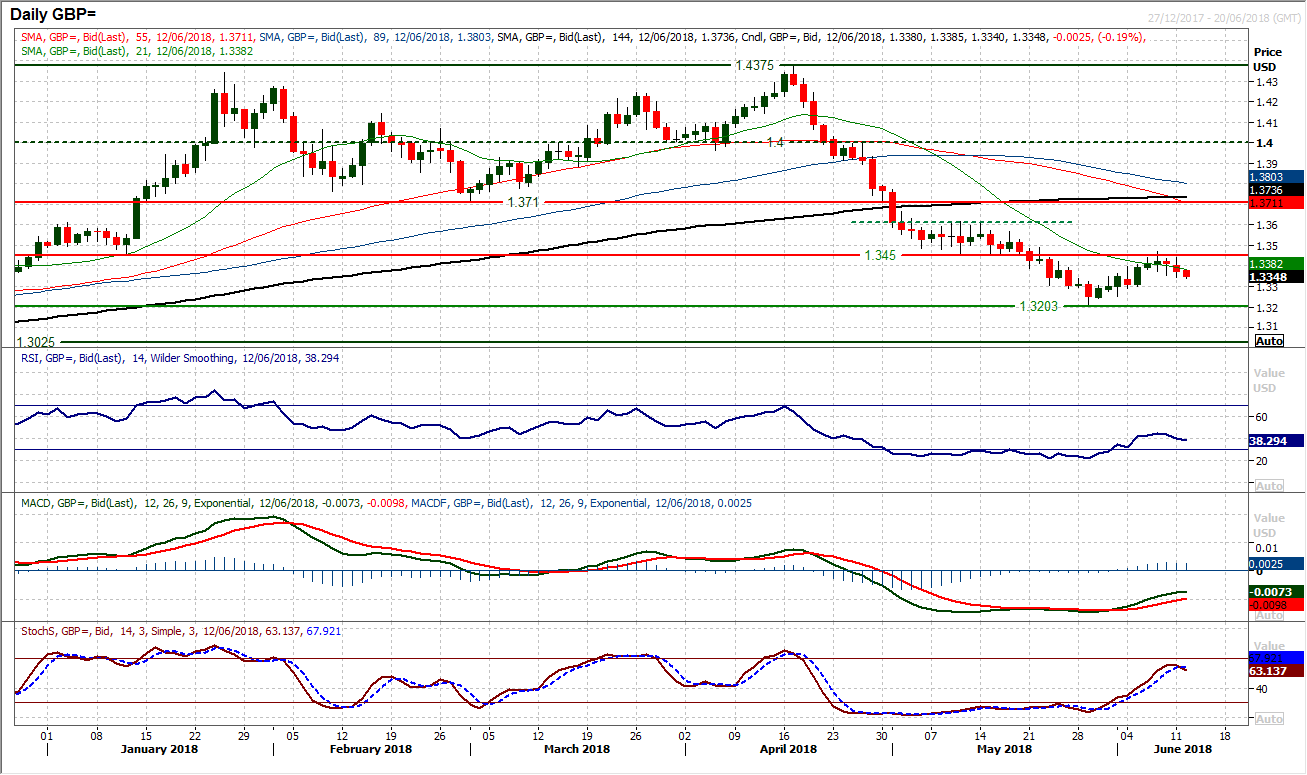
The recovery is beginning to turn lower. Yesterday’s weaker than expected UK industrial data certainly did not help sterling but with the dollar also starting to regain ground, the formerly positive candlesticks are turning more negative once more. The momentum indicators are also starting to deteriorate, with the RSI back below 40 and the Stochastics crossing back lower. With the market pulling lower from the pivot around $1.3450 a run of daily lower lows is building. On the hourly chart this is putting big pressure on the recovery uptrend channel which is now being broken as the market is starting to take on a more corrective configuration on hourly momentum indicators. If the hourly RSI continues to fail under 60 and MACD lines fail under neutral then expect the pivot support at $1.3345 to come under further scrutiny. The support at $1.3290 is now a key higher low in the recovery. Initial resistance at $1.3400 today.
USD/JPY
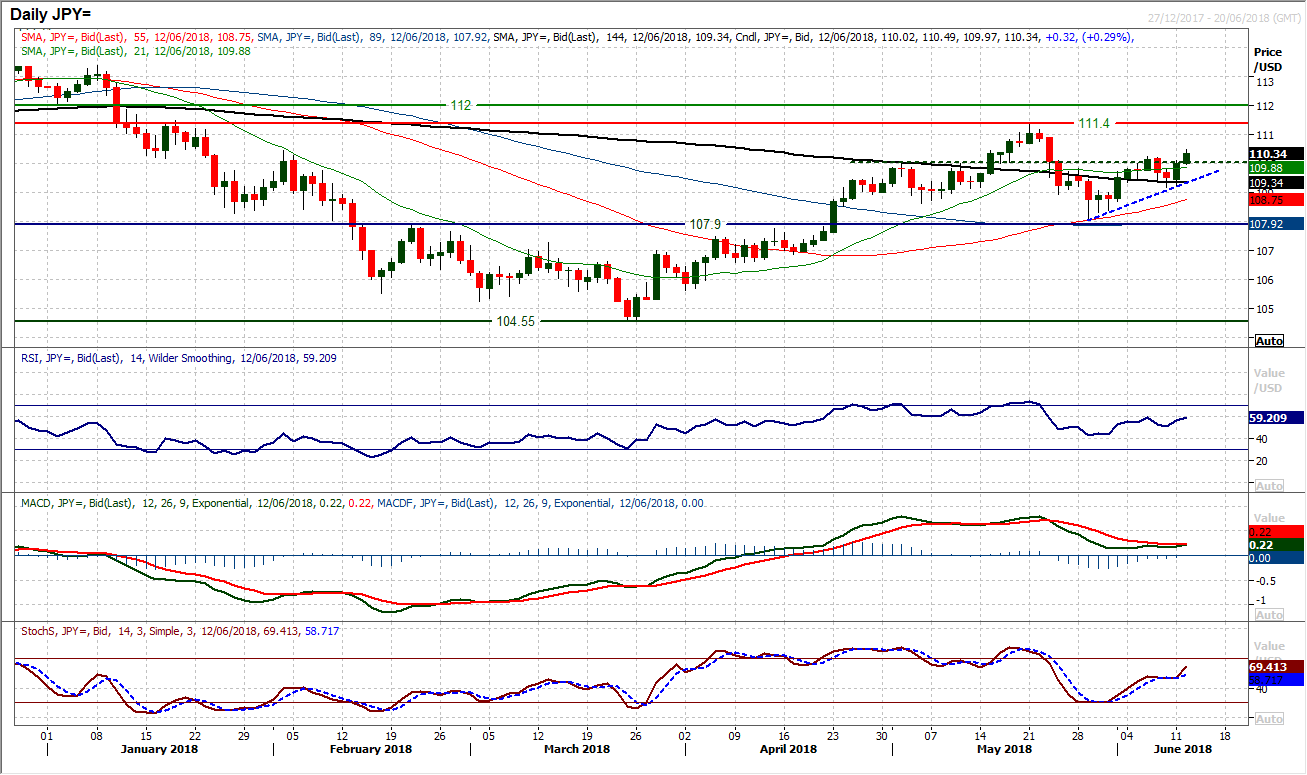
With the Trump/Kim summit seemingly going smoothly, there has been a shift away from safe haven plays, with the yen under pressure. This has driven Dollar/Yen through 110.25 and a closing breakout today would imply the 111.40 resistance is back in play. Technical momentum indicators look to be gaining traction once more with the RSI ticking higher towards 60, whilst the sensitive Stochastics also look to be bull kissing higher. The market is also now looking to leave a higher low at 109.17 as key support now. The hourly chart shows a more positive configuration, whilst leaving the old pivot at 110.00 behind means there is now a basis of support today at 110.00/110.25 to use for buying into weakness.
Gold
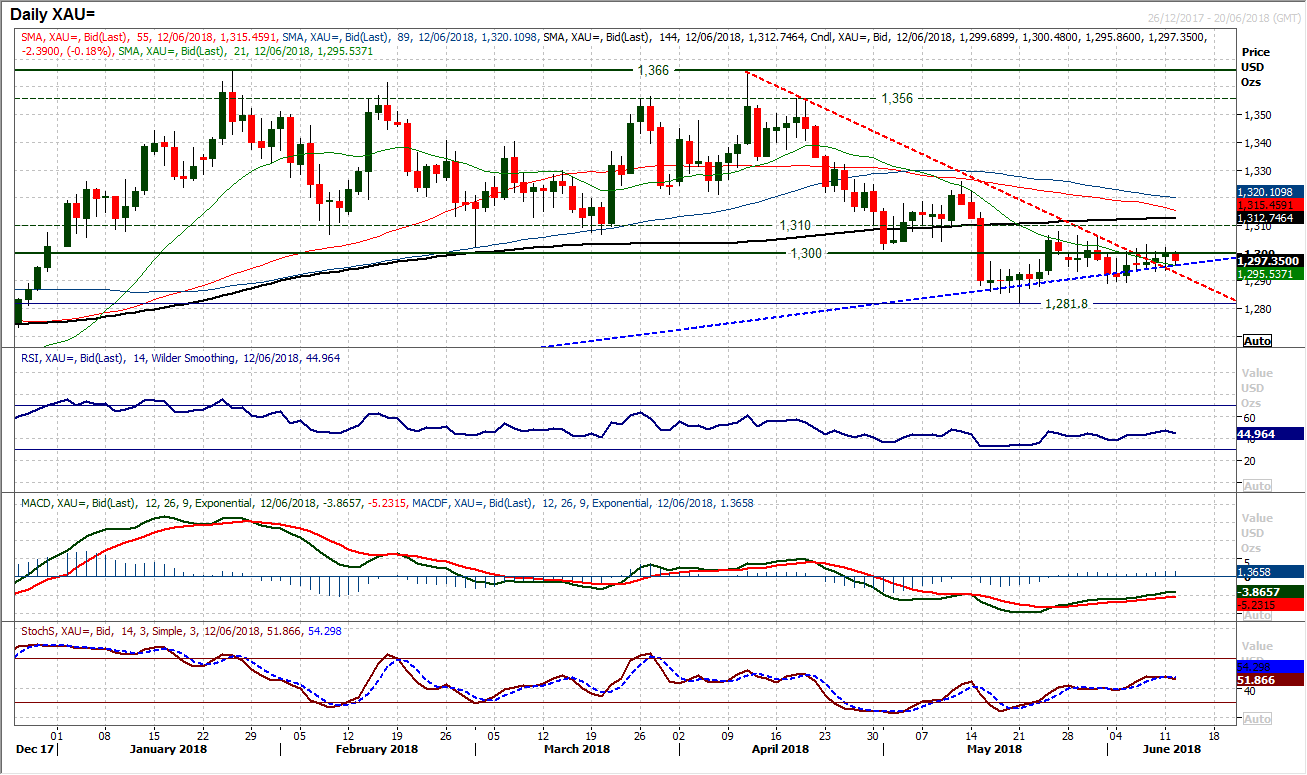
The consolidation on gold continues. Amid the uncertainty of how the Kim/Trump summit would play out, gold has been able to find any direction in the past week, and although there is a mild move lower on the initial positive signals from the summit, there is still little real suggestion that gold is about to find direction. The long term pivot band $1300/$1310 remains a basis of resistance and yesterday’s close almost bang on the resistance at $1300 reflects the consolidation. Momentum indicators retain their corrective medium term outlook but with a near term consolidation. Rallies continue to fail above $1300, whilst initial support at $1289/$1290 is protecting the May low at $1281.80. With the improved risk appetite there could now be a downside bias to form, but essentially the market is still looking for direction.
WTI Oil
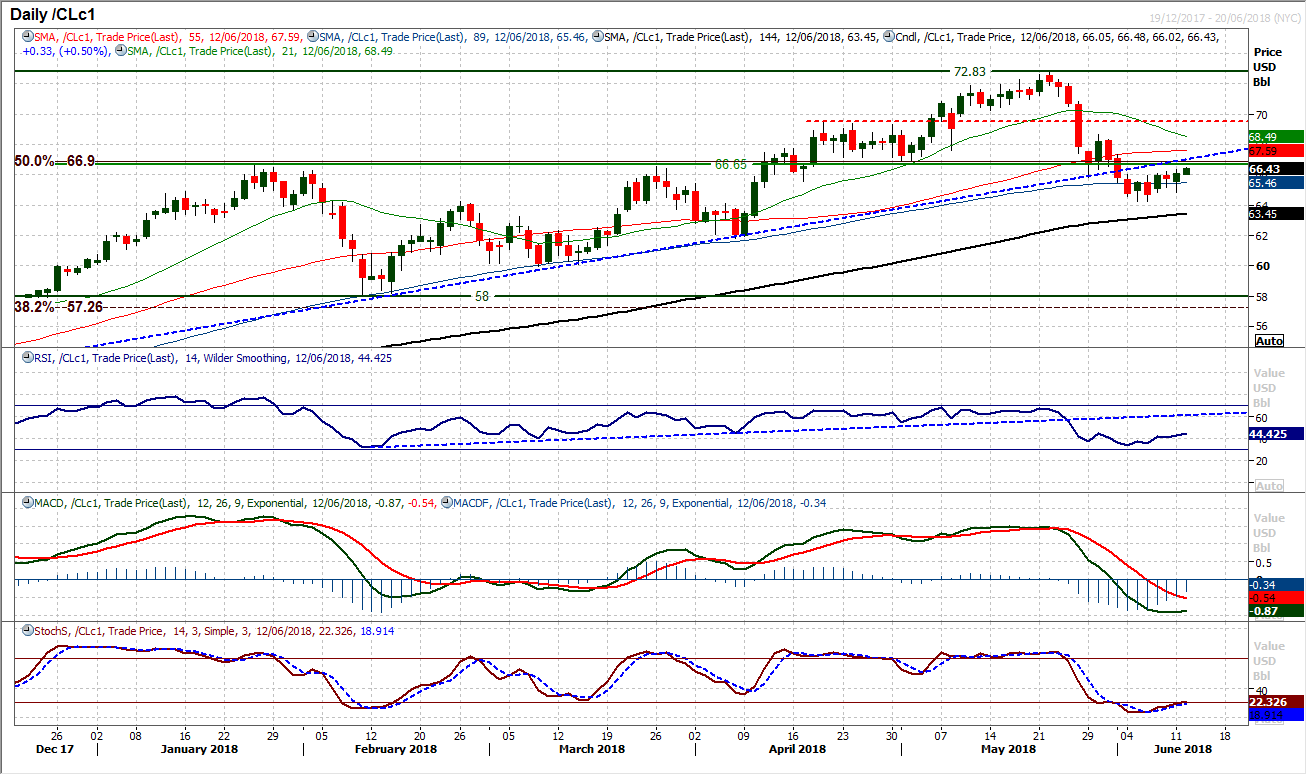
There certainly seems to be a degree of support building on WTI as another intraday dip has been bought into and the market has formed a positive candlestick. This continues to bolster the lows of last week around $64.25. However, whether this is simply the market consolidating before renewed selling pressure is yet to be ascertained. There is a mild improvement in the momentum indicators which have previously been strongly negative, with the Stochastics and RSI starting to tick higher. Despite this though, there is a need to break through the resistance of the old pivot at $66.65 (preferably on a closing basis) in order for the bulls to confirm a more positive outlook. The reaction high at $68.65 is key near term resistance.
Dow Jones Industrial Average
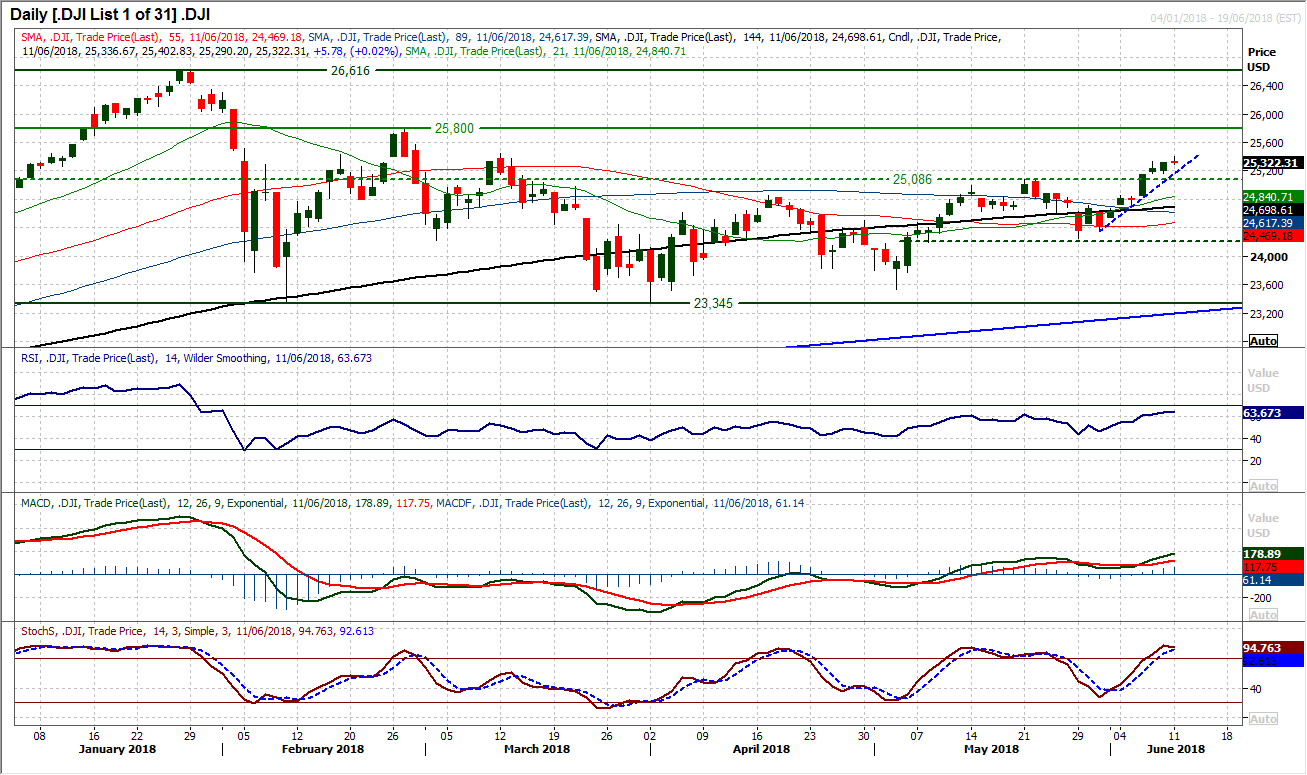
The bulls continue to pull the market higher as another positive close was seen yesterday and the uptrend of the past eight sessions builds further. Although yesterday’s candlestick was very mildly negative (with the close below the gapped higher open), this is likely to have been simply a consolidation session with the uncertainty of the Trump/Kim summit. Moving further into new highs dating back to mid-March, the market is still positioning for a test of the resistance at 25,449. Momentum indicators remain set up positively with the RSI into the mid-60s whilst the Stochastics are also positive. Corrections are a chance to buy with the uptrend at 25,270 today and the breakout 25,086 as a strengthening basis of support.
Author

Richard Perry
Independent Analyst


