Trading the UKOIL-USOIL Spread

Both UKOIL and USOIL are important in the energy sector, as they reflect the two most important types of Oil: UKOIL refers to the Brent crude which is extracted from the Oil fields in the North Sea, and USOIL refers to Western Texas Intermediary (WTI) which is extracted from the Oil fields in the United States. UKOIL is the reference Oil price for about two-thirds of the oil traded around the world, while WTI is, expectedly, the dominant benchmark in the US.
The main differences between the two types relate to their API Gravity, i.e. how light or heavy they are, and their sulfur content. Both WTI and Brent are considered to be light crude oils, however, the former is lighter than the latter. In general, the lighter the crude oil, the higher the price as they produce a higher percentage of gasoline and diesel fuel per barrel of crude oil when converted into these products by a refinery. Regarding sulfur, WTI’s content is lower than that of Brent’s, even though both belong in the sweet crude oil category, making them easy to refine and safer to extract than sour. By contrast, crude produced by OPEC countries tends to be relatively sour.
Overall, WTI is both lighter and sweeter than Brent, which should make it more expensive given that it can refined into fuel more easily. Given that WTI is mostly landlocked though, and thus not easily transferred, prices for both types of Oil have always traded at more or less the same levels, at least until 2011. Since then, the Shale Oil revolution has changed the world of refining by providing even lighter oils for processing. Remember that WTI was mainly refined within the US, given that the country had been a net importer of Oil for the past 75 years. This forced refineries to be built in a way that accommodated both Brent and WTI, where the former represented the bulk of foreign imports and the latter represented domestic production.
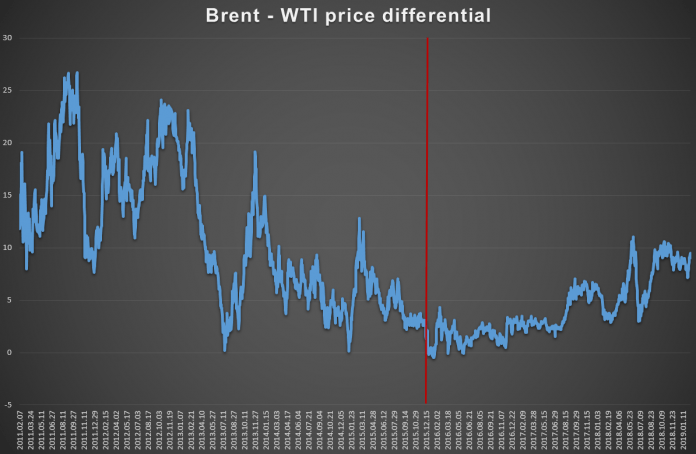
The problem with Shale oil is that it is too light to be refined and thus they have to mix it with heavier crude (such as Venezuelan oil) in order to be able to process it. Given that exports from the US were not allowed, the boom in the Shale Oil production forced the country into overabundance, and thus pushed the WTI price lower. This was more or less resolved in December 2015, when the ban on US crude Oil exports was lifted. This pushed the Brent-WTI price differential close to zero, a level which was more or less maintained until mid-2017, whereas prices once again diverged by more than $5.

After the effect from the lifting of the US Oil export ban subsided, what mattered most was proximity. Given that the US is not as close to the countries which have significantly increased demand (notably Asia and Africa) over the past years, the increased cost of shipping WTI from the US to China or Bangladesh would make it far cheaper to ship it from the Middle East, as travel time would be halved. As already noted, Brent prices are used in the Middle East.
Thus, as demand for Oil increases in Asia, and given that the US is closer to Europe whose demand for Oil has been declining, Brent-based contracts are likely to dominate the markets in the coming years. As such, the spread between Brent and WTI is also likely to continue its increase, even though the level is likely to be affected by other factors as well.
Still, that does not mean that the spread is always meaningful: there are times when the markets may overdo it with the spread which then returns sharply down. June 2018 is a good example, with the spread jumping to $10 in the first 10 days of the month, only to return to $3 in the first days of July. The inverse relationship is also statistically valid, as a regression analysis using daily data from January 2018 until now suggests that the spread’s value in the previous day has a statistically significant negative effect on the Brent price, with the coefficient standing at 0.05.
Note that any type of such statistical analysis is unlikely to be able to fully capture the extent of the relationship. The formula would interpret a drop in the Brent price following a decline in the spread as evidence of a positive relationship, something which could have just happened on a whim, or because the market realized that Brent was overpriced, or even that Brent declined by more than WTI on days during which the spread was high.
This is what happened during the June-August 2018 period, when the price of WTI increased by more than the Brent price, in the lead-up to the end of June, with the spread between the two remaining relatively stable for a month. Then, after mid-July the spread rose again reaching around $7 by the end of August.
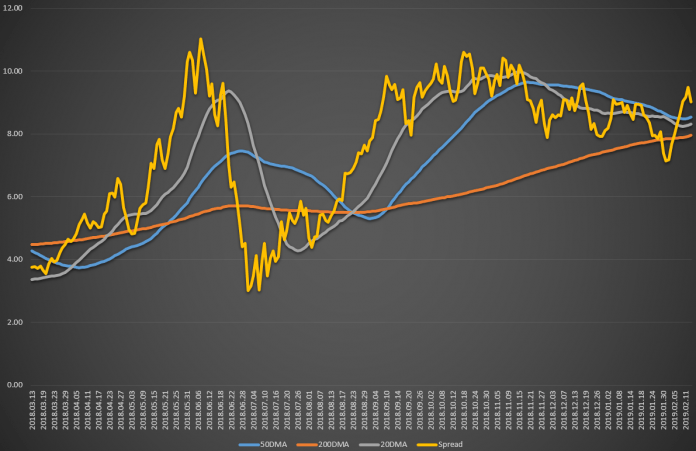
Using the Brent-WTI spread and its 20-day, 50-day, and 200-day MAs, the 20DMA peaked on June 22, and indicated a turnaround from the June highs on July 05, at which point the 20DMA crossed the 50DMA. A further confirmation arose when the 20DMA crossed the 200DMA on July 13, however, this should have been viewed with caution as the spread closed on its 200DMA. At the moment, the spread appears to be heading downwards, with the 20DMA crossing the 50DMA on November 29, 2018. The two MAs appeared to have been converging, however, an unexpected decrease in the spread pulled the 20DMA down again.
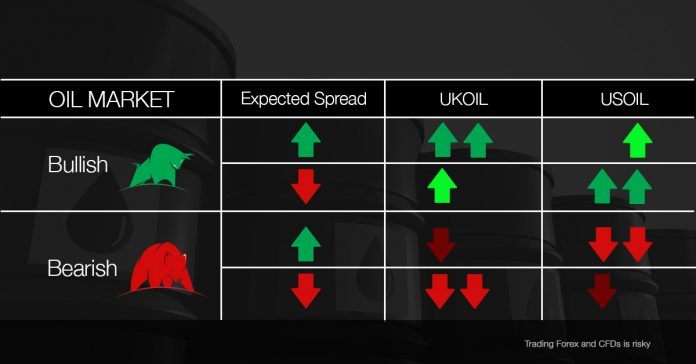
Importantly, the spread can provide valuable information for traders. As suggested above, an increase in the spread suggests either Brent is over-reacting or WTI is under-reacting to an overall Oil market movement. As such, if the spread is expected to increase, traders could position themselves to gain from this in a simple way: if Oil prices are increasing, knowing that the spread will increase suggests that UKOIL is expected to make a bigger move than USOIL and thus it would be more profitable to trade it. To sum this up, have a look at the following table: if we are seeing a bear market, then expectations of an increase in the spread would imply a USOIL over-reaction. On the other hand, if we expect that the spread will decrease, this would imply a UKOIL over-reaction. On the other hand, if Oil prices are increasing and the spread is decreasing then USOIL is expected to make a larger move than UKOIL.
Overall, understanding where the spread is headed can provide the trader with important information regarding the instrument which is likely to make the biggest move. Knowing this, can make the trader more equipped to pick an instrument for his/her position; at the same time, proper risk management is very important.
Author

With more than 4 years of experience at the Central Bank of Cyprus where he obtained hands-on experience with real-life economics, Dr Nektarios Michail is a supporter of a balanced approach between science and art when it comes to


