Trading on the Gold Silver Ratio

XAUUSD, XAGUSD, US500, USDIndex, M15 D1
The Gold Silver Ratio (GSR) simply refers to the extent that the price of Gold is higher than the price of Silver, or in economic parlance, the relative price of Gold to Silver. The comparison is very easy, as both precious metals are measured in ounces: if the price of Gold is $1200 and the price of Silver is $12, the GSR stands at 100. The idea behind the ratio is simple: given that both are precious metals, their value as investments should be determined by their scarcity. As such, the rarest of the two should be more expensive.
This is not the whole story, however. Silver, in contrast to Gold, has actually many industrial uses, with more than 50% of its demand in 2017 being employed for industrial purposes. In contrast, Gold only has very few industrial uses, with just 17% of its uses relating to industry. As such, if scarcity was the only determinant of the price differential between Gold and Silver, then the GSR would stand at about 7, or maybe even 22 if available reserves are taken into consideration. In reality, over the past 8 years, the GSR averaged at 64.7, with a low value of 31.7 in 2014 and a high of 83.3 in 2016, suggesting that many other factors play a role in determining the relative price.
So, how can a trader use the GSR? Expectedly, there exists an positive relationship between GSR and the price of Gold. Sceptics would rightly argue that this is obvious given that the higher the price of Gold, the higher the GSR, if no change in the price of Silver takes place. However, what would be useful is to examine whether the previous day’s GSR would have any effect on today’s price. To examine this, we have conducted regression studies to explore the relationship between the change in the price of Gold today and yesterday’s change in the GSR. However, to do this, we need to also include a couple of more determinants in our estimation.
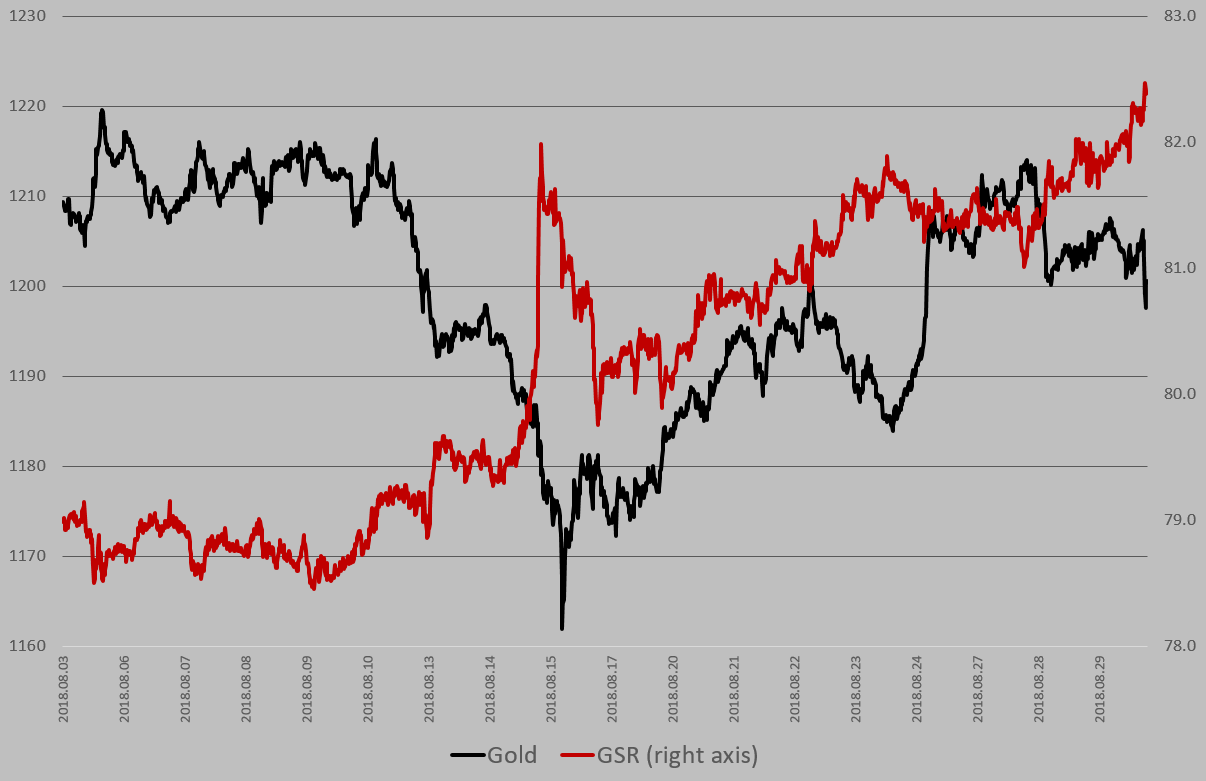
Remember that Gold is usually seen as the safe harbour when the world economy goes south. In essence, Gold acts like a hedge against the possibility of a downturn, a behaviour evidently seen during the Great Recession period (2008-2009). While there is no tradeable measure of the world economy, this is usually proxied by US economic performance. As such, Gold would be expected to have a negative relationship with the US economy. In this context, the simplest and most accurate way to account for the US economy is to use the USDIndex rate which, given that currency markets move extremely fast, incorporates all available information as well as market perceptions regarding the US economy at any point in time. To further accommodate the impact of the US economy on the price of Gold, we also have to accommodate for the US stock market in our estimations. The total sample size stands at 1532 observations dating from August 03, 2018 to August 29, 2018. Naturally, the fact that the data only cover one calendar month, and one which usually has lower trading volume than usual presents an obvious caveat to the results shown below.*
The regression analysis suggests that the USDIndex has a strong negative relationship with the price of Gold (at -0.92), emphasising the inverse relationship between Gold and the US economy. The US stock market is not found to have an impact on the price of Gold, most likely because we have already accommodated for US macroeconomic developments via the use of the USDIndex. In contrast, the GSR is found to have a negative relationship with the price of Gold. In particular, the change in the GSR in the previous hour, is found to have a negative relationship with the price of Gold at approximately 0.06. The impact of the USDIndex and the GSR are found to be statistically significant at the 1% level.
The success of the GSR can however, depend on the time horizon used. For example, when more than a month’s data are used, and a similar regression analysis is run using daily data from September 2011 to August 2018, with a total of 1780 observations, results are very similar for the USDIndex (-0.87). However, the data is not supportive of GSR having an effect on the Gold price. These results suggest that simply relying on one metric for the construction of a trading strategy can be useful some times and useless in other times. Thus, using the GSR can be helpful in providing information regarding the future movements of Gold, although careful analysis and research needs to be undertaken before committing to a trade. Traders need to remember that these are just indications and the need for proper risk management strategies always exists.
*For the interested reader, the model employed (in log first differences) in both cases was a regression with GARCH (1,2) errors, using XAU as the dependent variable, and US500, EURUSD, and GSR as the independent. Lags of the dependent variable to account for autocorrelation issues present at higher frequencies were also employed. Employing GARCH (1,1) errors made no significant difference on the results.
Author

With more than 4 years of experience at the Central Bank of Cyprus where he obtained hands-on experience with real-life economics, Dr Nektarios Michail is a supporter of a balanced approach between science and art when it comes to