Traders pause after jobs surge: Will today's economic news shift the momentum?

USD: Dec '24 is Down at 102.160.
Energies: Nov '24 Crude is Down at 75.91.
Financials: The Dec '24 30 Year T-Bond is Down 3 ticks and trading at 121.07.
Indices: The Dec '24 S&P 500 emini ES contract is 84 ticks Higher and trading at 5765.75.
Gold: The Dec'24 Gold contract is trading Up at 2667.30.
Initial conclusion
This is not a correlated market. The USD is Down and Crude is Down which is not normal, and the 30 Year T-Bond is trading Lower. The Financials should always correlate with the US dollar such that if the dollar is Higher, then the bonds should follow and vice-versa. The S&P is Higher and Crude is trading Lower which is correlated. Gold is trading Higher which is correlated with the US dollar trading Down. I tend to believe that Gold has an inverse relationship with the US Dollar as when the US Dollar is down, Gold tends to rise in value and vice-versa. Think of it as a seesaw, when one is up the other should be down. I point this out to you to make you aware that when we don't have a correlated market, it means something is wrong. As traders you need to be aware of this and proceed with your eyes wide open. Asia traded mainly Lower with the exception of the Sensex and Shanghai exchanges. All of Europe is trading Lower.
Possible challenges to traders
NFIB Small Business Index is out at 6 AM EST. This is Major.
Trade Balance is out at 8:30 AM EST. This is Major.
RCM/TIPP Economic Optimism is tentative. This is Major.
FOMC Member Bostic Speaks at 12:45 PM EST. This is Major.
FOMC Member Collins Speaks at 4 PM EST. This is Major.
Traders, please note that we've changed the Bond instrument from the 10 year (ZN) to the 2 year (ZT). They work exactly the same.
We've elected to switch gears a bit and show correlation between the 2-year Treasury notes (ZT) and the S&P futures contract. The YM contract is the Dow Jones Industrial Average, and the purpose is to show reverse correlation between the two instruments. Remember it's likened to a seesaw, when up goes up the other should go down and vice versa.
Yesterday the ZT migrated Higher at around 9 AM EST with no real economic news in sight and began its Upward climb. Look at the charts below and you'll see a pattern for both assets. The Dow moved Lower at 9 AM and the ZT moved Higher at around the same time. These charts represent the newest version of Bar Charts, and I've changed the timeframe to a 15-minute chart to display better. This represented a Long opportunity on the 2-year note, as a trader you could have netted about 20 ticks per contract on this trade. Each tick is worth $7.625. Please note: the front month for ZT is Dec and the Dow is now Dec '24. I've changed the format to filled Candlesticks (not hollow) such that it may be more apparent and visible.
Charts courtesy of barcharts
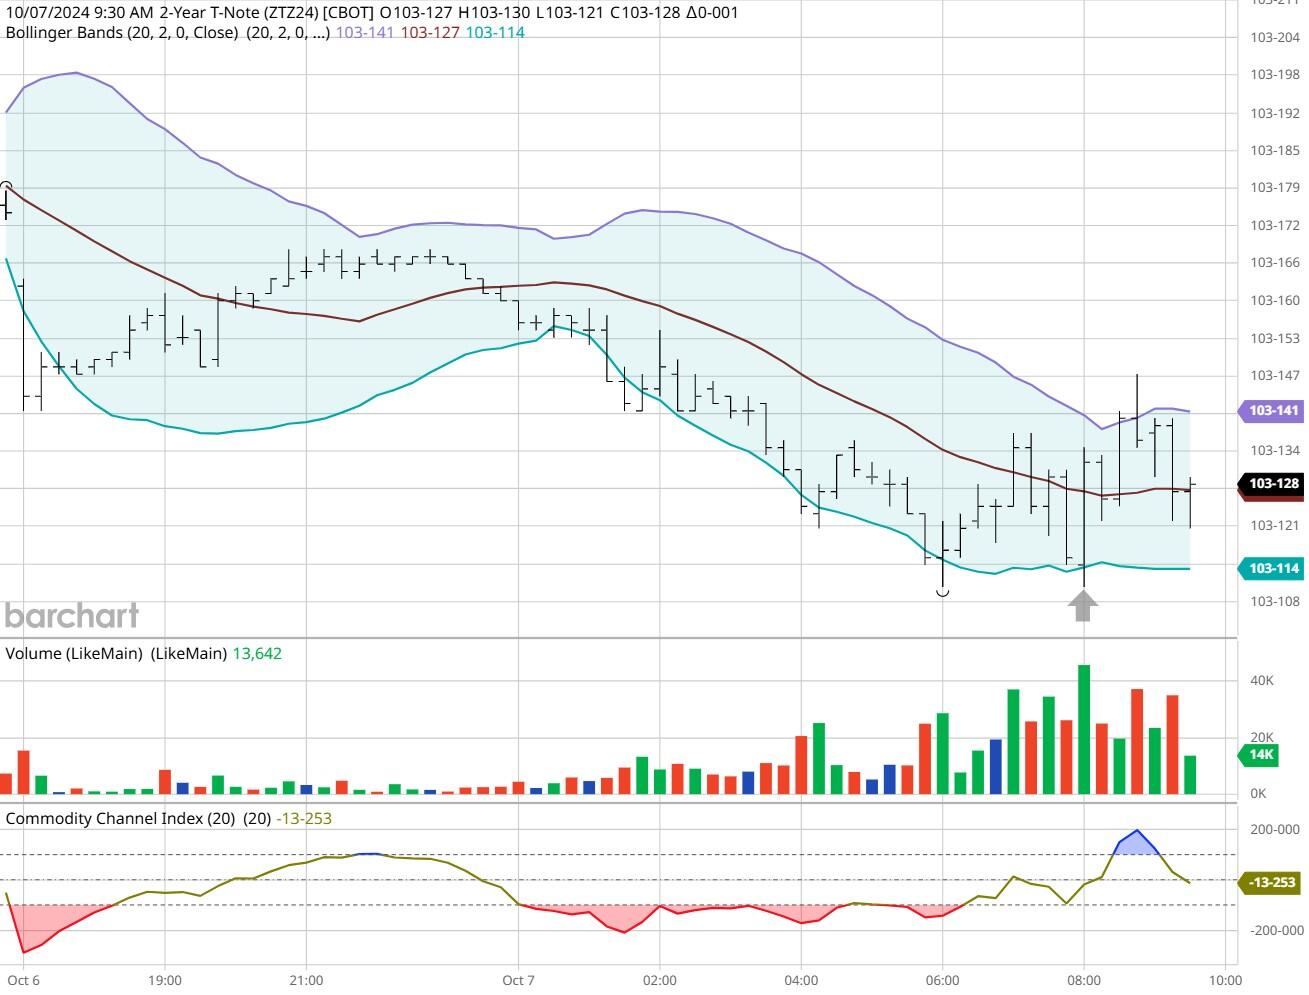
ZT -Dec 2024 - 10/07/24
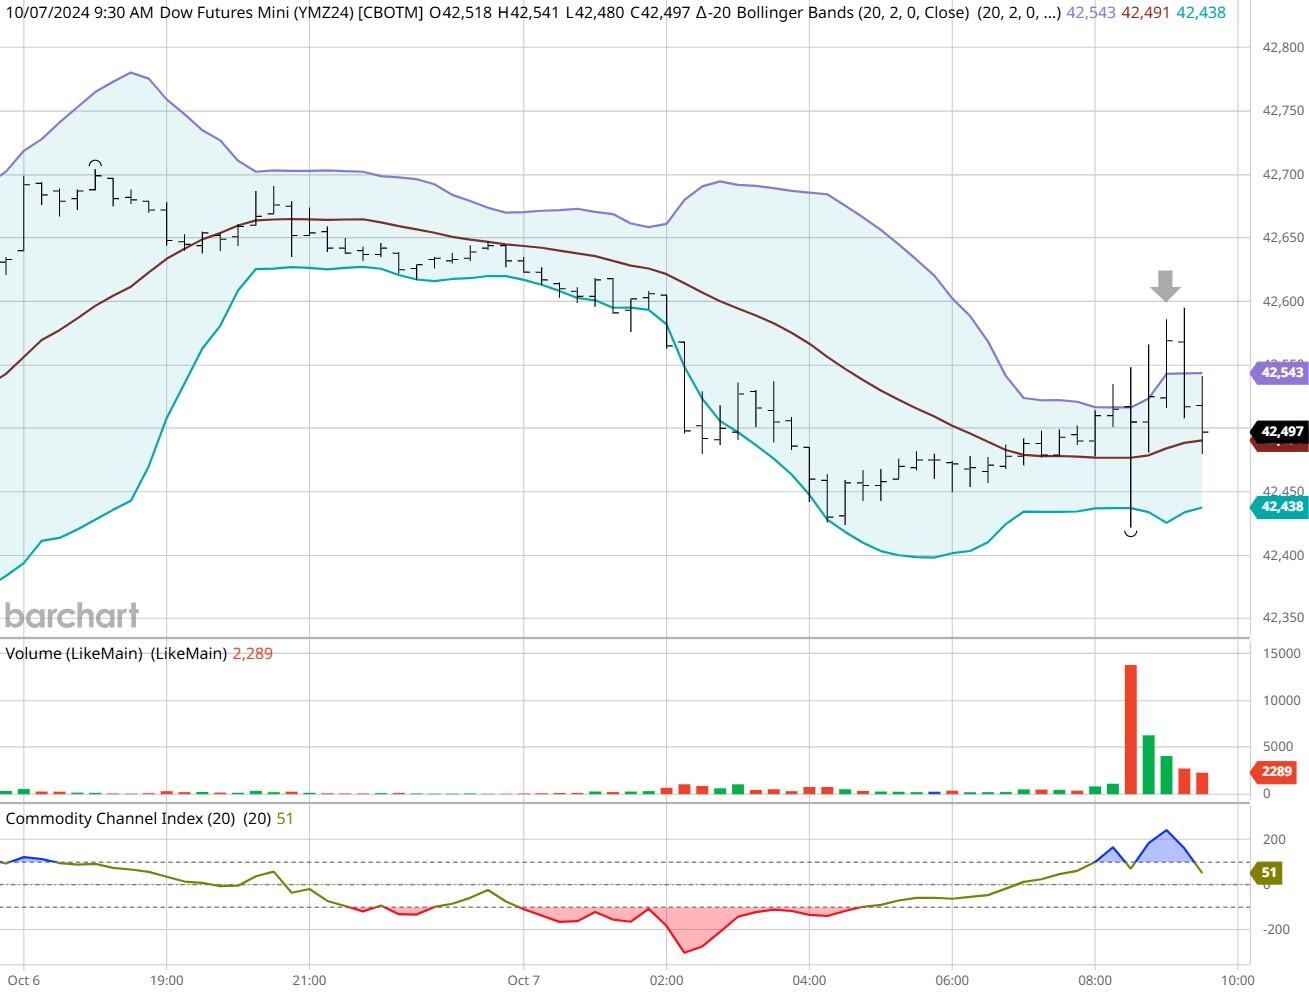
Dow - Dec 2024- 10/07/24
Bias
Yesterday we gave the markets a Downside bias as the USD, Crude and Gold were all trading Higher Monday morning and that usually reflects a Down Day. The markets didn't disappoint as the Dow closed Lower by 399 points and the other indices lost ground as well. Today we aren't dealing with a correlated market and our bias is to the Upside.
Could this change? Of Course. Remember anything can happen in a volatile market.
Commentary
Well, yesterday it seemed as though traders wanted to take money off the table in light of Friday's runup on strong Jobs numbers. Yesterday we had no major, earth shattering numbers but relied on our principles of market correlation. That didn't fail us. Today we have a bit more in terms of economic news as we have Small Business Index, Economic Optimism numbers and a few FOMC members speaking. Will we see the same result as yesterday? Only time will tell.
Author

Nick Mastrandrea
Market Tea Leaves


