Trade war threat 'on hold' to drive risk and the dollar positive

Market Overview
Markets are reacting to the news that the threat of a trade war between the US and China has been put on hold, for the time being. Talks between US and Chinese negotiators seem to be progressing well enough for US Treasury Secretary to announce that “we are putting the trade war on hold”. For now, clearly we should ignore the fact that Mnuchin is admitting that there is actually a “trade war” in the first place and instead look on the happy side of this. That means the prospect of retaliatory tariffs between the world’s two largest trading nations which would cause negative ripples across global supply chains. China has apparently agreed to import more US goods in order to close the $335bn trade deficit for the US. Market reaction has been very risk positive and dollar positive, driving Treasury yields back higher, gold into retreat, equity markets higher and the dollar also stronger. Ultimately, the proof is in the pudding over reduction of the deficit, whilst US concerns over intellectual property and cyber security are yet to be met. However it is clearly a step in the right direction and markets are responding.

Wall Street closed slightly lower on Friday with the S&P 500 -0.3% at 2713, whilst with Wall Street futures higher overnight and Asian markets broadly positive (Nikkei +0.3%), we see European indices also making strong early gains. In forex majors, the dollar is broadly stronger, although it is interesting to see the commodity currencies holding up well as the Canadian and Australian dollars are doing relatively well. In commodities, the stronger dollar and better risk appetite is hitting the safe haven gold price which is around $8 (around 0.6% lower) whilst oil is around +0.7% stronger and looking to push higher again.
There are no key economic releases due today.
Chart of the Day – FTSE 100 Index
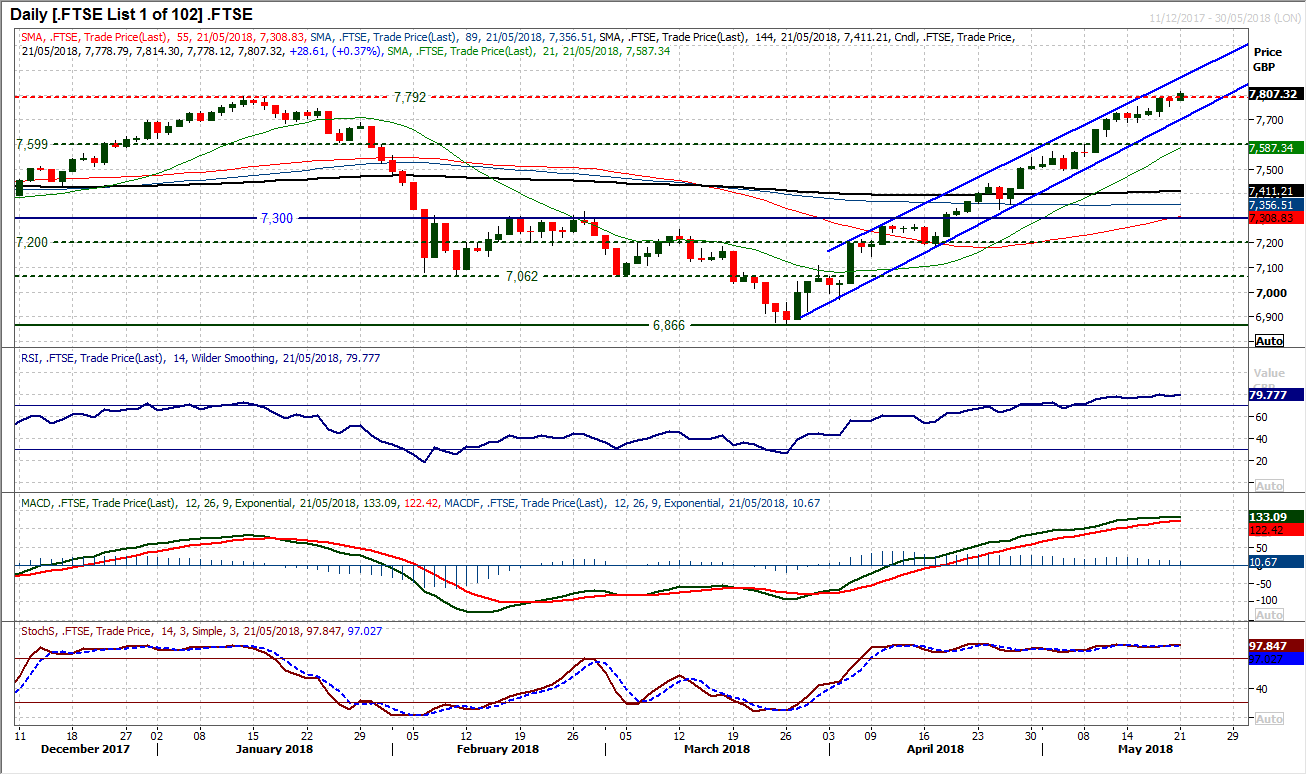
What a bull run on UK’s primary index (that is not something that could have been said too often over the years). The FTSE 100 has outperformed its European peers and even the S&P 500 in the past eight weeks since the key low at 6866 back in late March. The run has completely flipped the outlook around and saw the market test the all-time high on Friday at 7792. Although there was a failure bang on the 7792 all time high, this level is being smashed this morning as the bulls have come in with gusto. However, this move needs to be sustained and not least confirmed by a closing breakout above 7792. Certainly, the initial signs are strong as the early move breaks into all-time highs. Once more it would seem as though the market has averted the potentially hazardous profit-taking that could come with a second successive negative candle. Throughout the run higher of the past eight weeks, never once has the market closed lower on two successive sessions. The market would sit up and take notice if it were to happen now. Betting against equities has been a losing game over recent weeks, but markets do not run higher forever. Initial support is at 7714 with last week’s low at 7687 the key near term support to watch. Also watch the RSI which having reached 80 last week, a cross back below 70 would be a key signal. The momentum indicators have been gradually slowing their advance in the past week and profit-taking could be a key factor this week. The support of the uptrend channel is at 7700 today. A breakout above 7792 would be a breakout to all-time highs.
EUR/USD
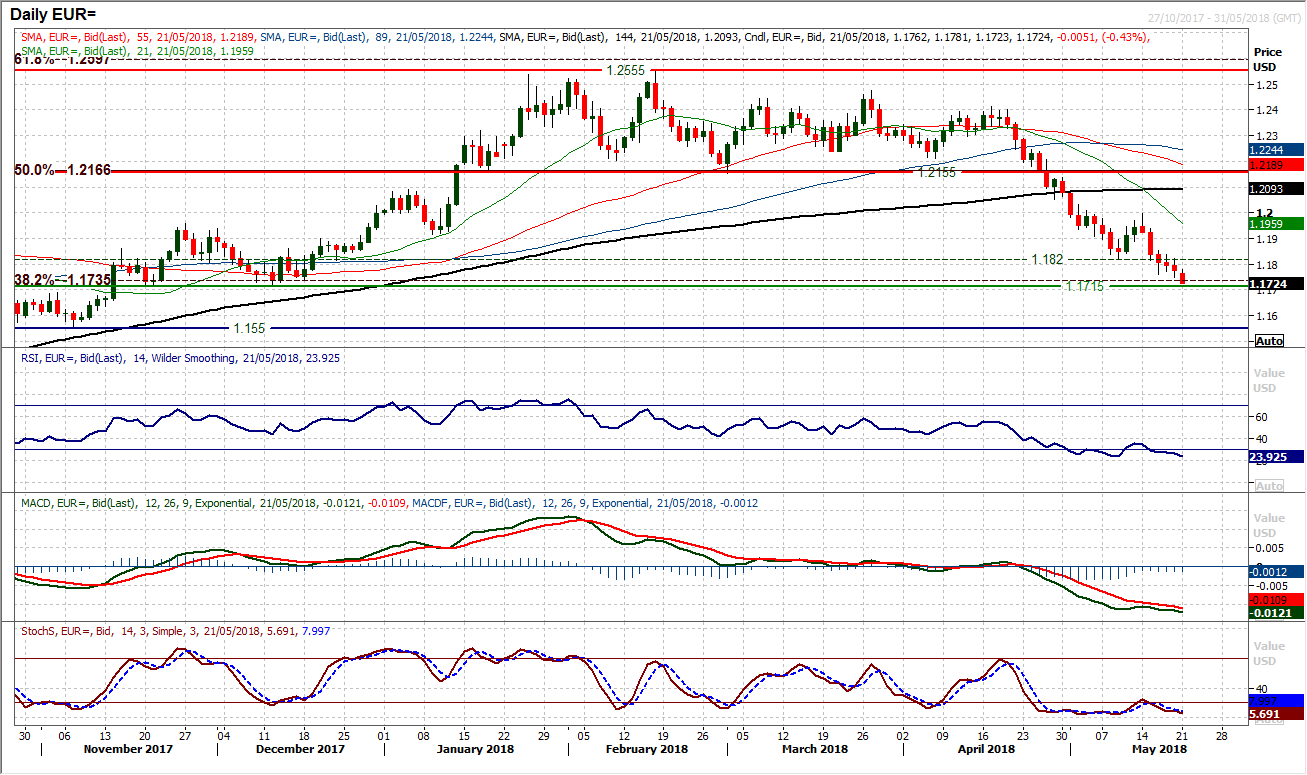
With the dollar remaining strong this morning and the euro still pressured by Italian politics, we find the move lower on EUR/USD continuing. The pair dropped throughout the course of last week and is now well within range of a test of the key reaction low at $1.1715 from December. Momentum indicators remain solidly negatively configured, with the RSI dropping into the mid-20s whilst the MACD and Stochastics both decline in bearish configuration. Intraday rallies continue to be sold into and old support around $1.1820 is now a basis of resistance. The hourly chart shows that there is a band of initial resistance $1.1820/$1.1855 now. Although the downside target of the original 400 pip top of $1.1755 has already been achieved, it does seem that there is no let up from the sellers for now and should the support at $1.1715 be broken there is little real support until the key reaction low from November at $1.1550.
GBP/USD
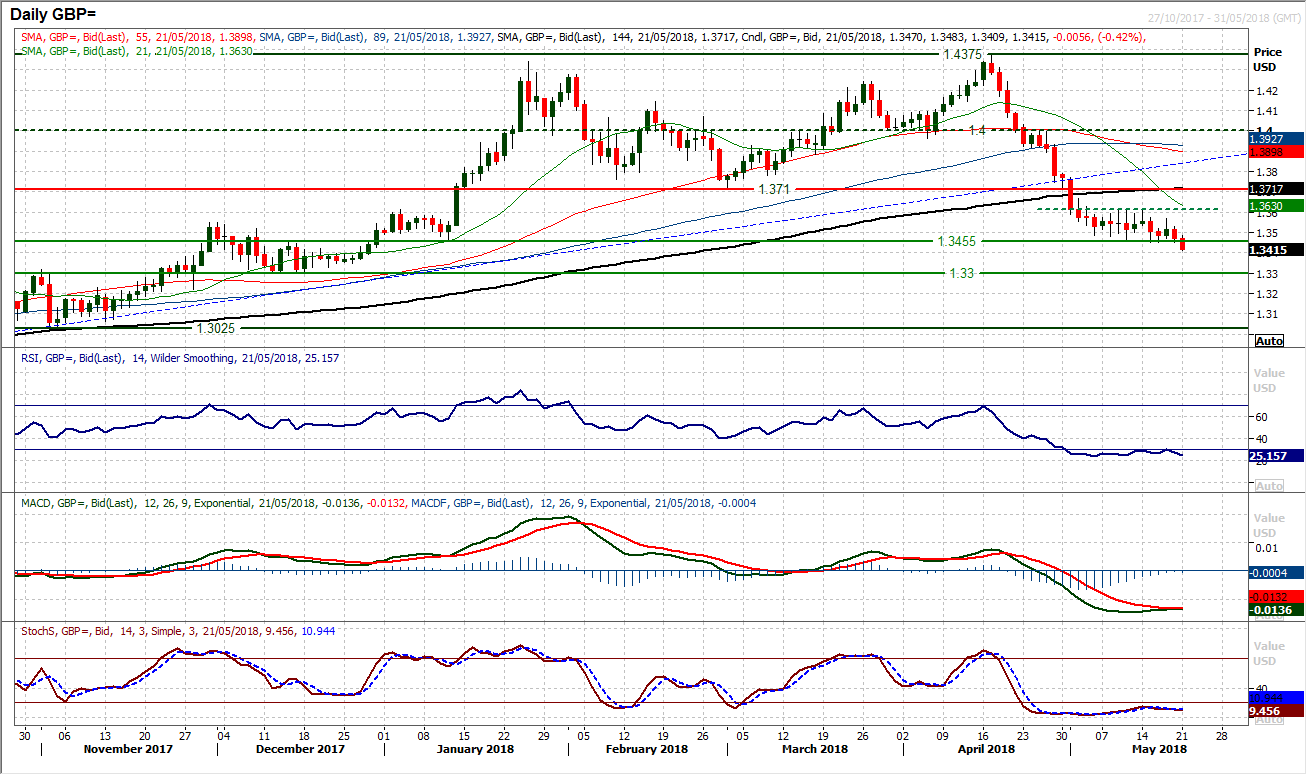
Sterling had been hanging on admirably last week as Cable consolidated in a tight 165 pip range between $1.3450/$1.3615, however the selling pressure mounted once more on Friday and this has continued into the new week to break the support. A close below $1.3450 would now imply 165 pips of downside target which brings the market right back to the key December low at $1.3300. Momentum indicators have remained in negative configuration throughout recent weeks and continue to show little appetite for recovery in the market for now. Failed rebounds in recent days have been turning back from lower levels leaving $1.3570 as the first real marker to consider. Selling into strength is the strategy again, whilst a close below $1.3450 will begin to see this develop as overhead resistance. The hourly chart shows intraday rallies being sold into, with $1.3480/$1.3530 an initial band of resistance today.
USD/JPY
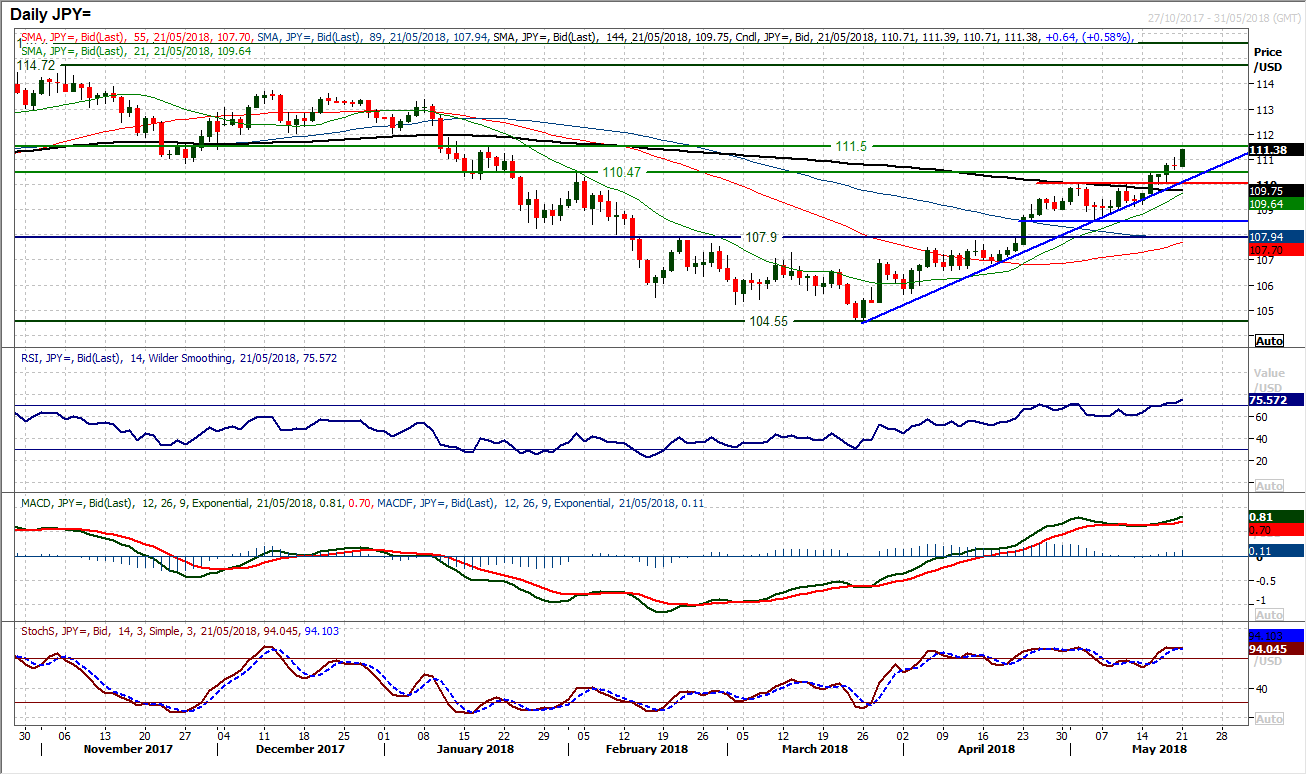
One more the bulls have coming into the new week with a spring in their step, as the market makes further strong gains. The breakout above 110.47 took a pause for thought on Friday with the marginal uncertainty that comes with a doji candle, however any sense of impending consolidation has been dispelled again today. The bulls are pushing on with the uptrend, which comes in today at 110.10. Momentum indicators remain positively configured and the RSI is now pushing into the mid-70s, which is the strongest since December 2016, a time during which the market added over 15 big figures in just over a month. We are not in that sort of territory yet, but it just helps to show that when Dollar/Yen trends, it really can move. The next resistance is at 111.50 and there is a band of resistance 111.50/112.00. The hourly chart shows the market is perhaps a touch stretched this morning coming into the European session, whilst any unwinding move is a chance to buy. There is a good band of support building 110.60/111.00 now.
Gold
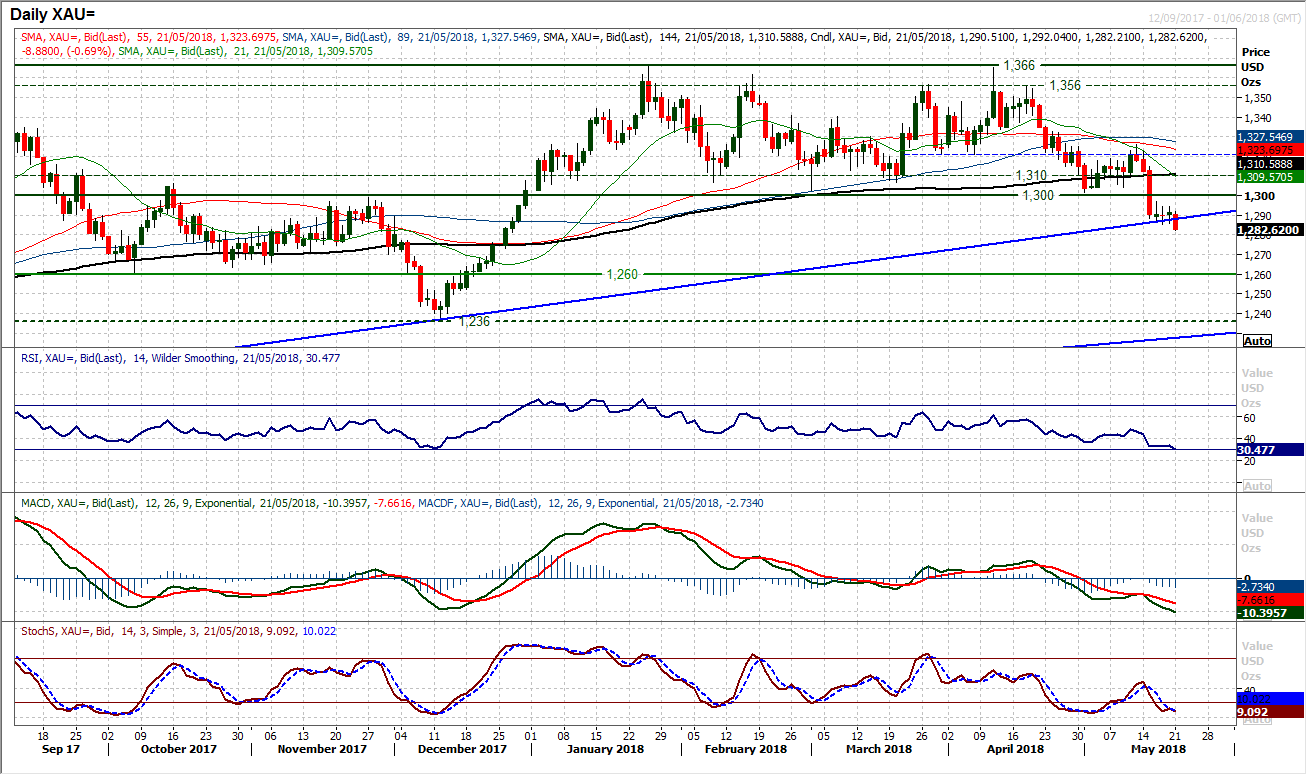
Having broken the crucial medium term support at $1300 the market spent much of last week in consolidation mode. The sellers remain in control following the Asian session, and stand close to further downside. Momentum indicators retain their negative configuration but also have further downside potential, with the RSI still yet to move below 30. On a medium term basis, any rebound in to the $1300/$1310 long term pivot is a chance to sell now (having seen this turn into an area of considerable overhead supply), however on a nearer term outlook, the resistance $1294/$1297 is building. Moving below the initial floor that built last week around $1285 would open the downside again with the implied target of $1235 but the next basis of support coming in at $1260.
WTI Oil
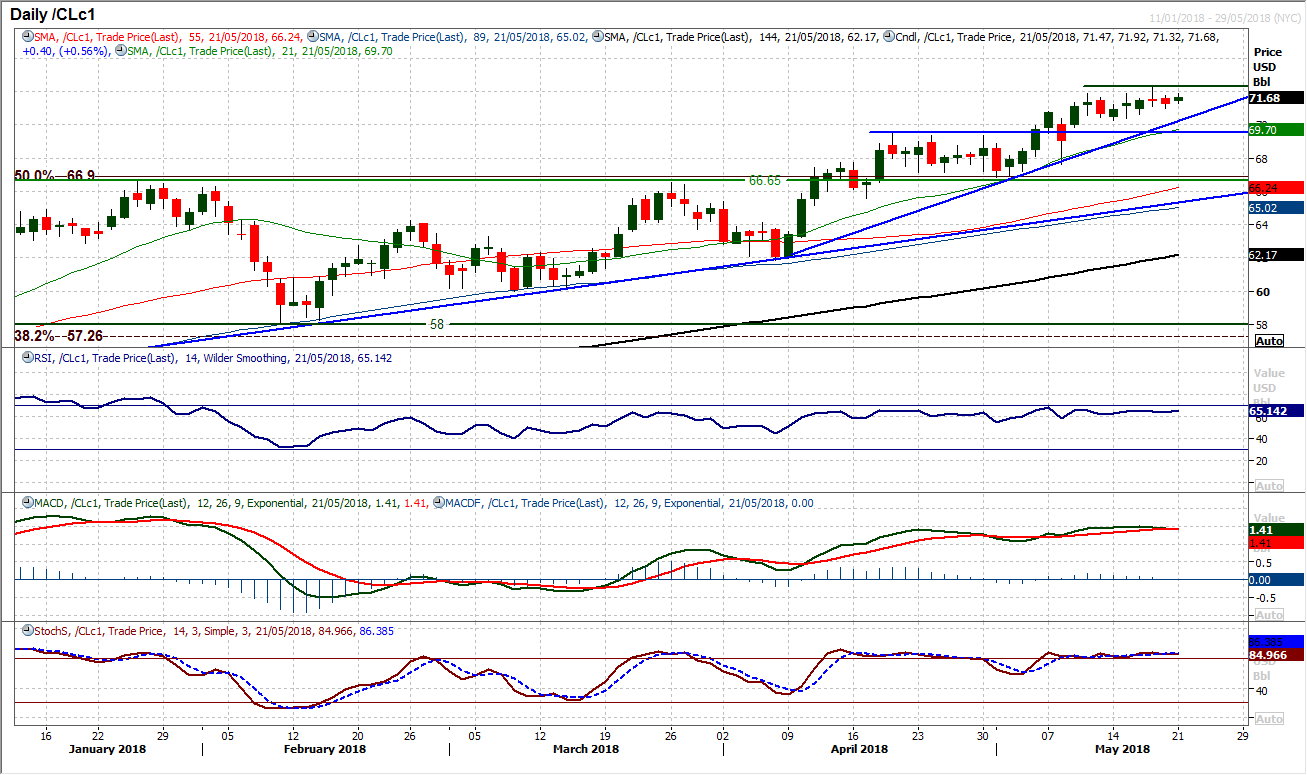
Consolidations remain a chance to buy on WTI. Although the market could not close above the initial resistance at $71.90 last week there is still a strong configuration across the momentum indicators that suggests WTI will continue to be bought into weakness. The trend higher of the past six weeks supports at $70.20 which is now a confluence of support with last week’s higher low (at $70.25). The last two candles show the bulls have been a touch stunted but there is nothing to suggest the run higher is going to end any time soon. Friday’s low at $71.00 is now the initial support to watch and helps to bolster the price above the $70.25 reaction low and the breakout at $69.55. Above $72.30 has the bulls looking at next overhead supply area $73.25/$77.85.
Dow Jones Industrial Average
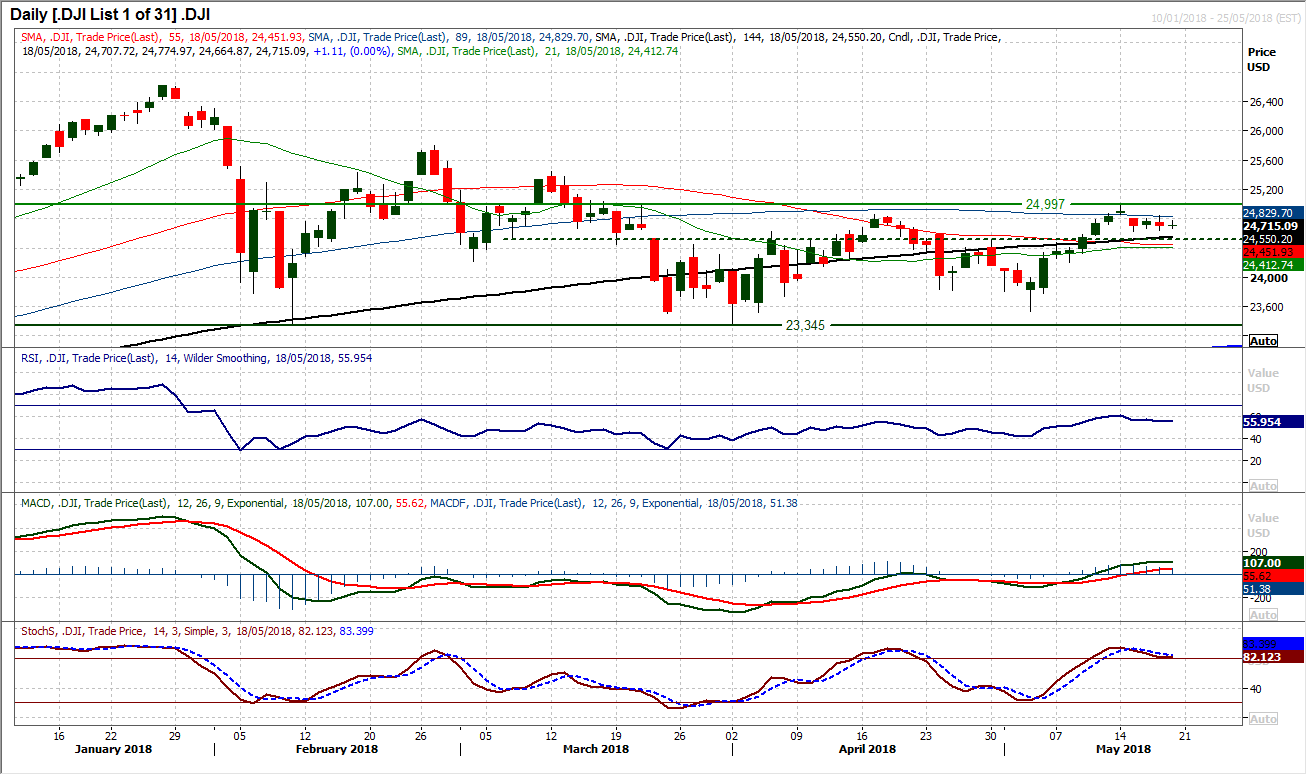
A consolidation of the Dow between 24,500 and 25,000 continues. Having broken the run of key higher lows a couple of weeks ago the market spent much of last week in consolidation mode. It appears that this is a crossroads for the Dow as the market settles down between a clutch of flat moving averages on the daily chart. Three successive non-committal candlesticks held up above initial support at 24,629 but with the futures pointing to a strong open today that looks set to fill the downside gap at 24,862, the bulls need to use this as an opportunity tp push on now. There is still a mild bullish bias on the balance of the momentum indicators (effectively in keeping with the improvement following the breakout of the lower highs above 24,859) which should help this move. This could be the catalyst the market has been waiting for and a closing breakout above 25,000 would be a driver of the next move. It would open the next key reaction high at 25,449. On a breakout, support at 24,629 would become key.
Author

Richard Perry
Independent Analyst


