Top Trade Setups in Forex - Risk Sentiment Remains Mixed
The ICE U.S. Dollar Index rebounded 0.2% on the day to 97.50 on Tuesday. The pound pulled back 0.6% to $1.2884, snapping a four-day rally. U.K. lawmakers rejected a limited timeframe to review the Brexit deal, making an extension of exit deadline more likely. The euro lost 0.2% to $1.1128 and USD/JPY slipped 0.1% to 108.49. The USD/CAD edged up 0.1% to 1.3095. Official data showed that Canada's retail sales fell 0.1% on month in August (+0.4% expected).
Meanwhile, NZD/USD was flat at 0.6411. New Zealand recorded a trade deficit of 1.24 billion New Zealand dollars in September (1.40 billion New Zealand dollars deficit expected), where exports amounted to 4.47 billion New Zealand dollars (4.30 billion New Zealand dollars expected).
USD/JPY - Double Bottom Level In Focus
The USD/JPY closed at 108.480 after placing a high of 108.727 and a low of 108.439. The overall movement for this pair remained Bearish that day.
The weak US Existing Home Sales data on Tuesday weighed on US Dollar, and hence, USD/JPY prices fell. At 19:00 GMT, the Existing Home Sales of United States for September came as 5.38M against 5.45M of expectations. At 19:05 GMT, the Richmond Manufacturing Index came as eight against the expectations of -7 for September.
USD/JPY has moved downward in the second day on the week due to weak macroeconomic data and the latest Brexit news. On Tuesday, the hopes of UK Prime Minister Boris Johnson of getting his Brexit deal fast-tracked through the UK Parliament were blown after the defeat of the government's timetable for Brexit in the voting session. That came after the government got the first reading of votes on the deal legislation to progress.
After the rejection of the timetable by the UK Parliament, Johnson gave threats to abandon the bill even if the EU granted an extension and said he would instead push for the general election. UK legislators argued that three days were not enough to examine the deal. Johnson then claimed that he would pause the legislation and go for a No-Deal Brexit on the said deadline of 31st October.
The rejection made it clear that Brexit on said deadline is impossible and removed the risk factor from the market, giving decreased demand for USD/JPY.
-637074360847681112.png)
USD/JPY - Daily Technical Levels
| Support | Pivot Point | Resistance |
| 108 | 108.32 | 108.75 |
| 107.57 | 109.07 | |
| 106.81 | 109.82 |
USD/JPY - Daily Trade Sentiment
On Wednesday, the technical side of the USD/JPY hasn't changed much. The USD/JPY pair continues its trade-in narrow trading range of 108.500 - 108.300. However, it looks pretty close to violating this trading level.
Looking at the 3-hour chart, the USD/JPY pair is trading below 20 periods EMA and has closed bearish engulfing candles, which are suggesting chances of further bearish bias.
For the moment, the horizontal support level extended by the double bottom at 108.300 is struggling to keep the USD/JPY bullish. A bearish breakout of 108.300 level can continue bearish rally until 108.
AUD/USD – Fibonacci Retracement In-Play
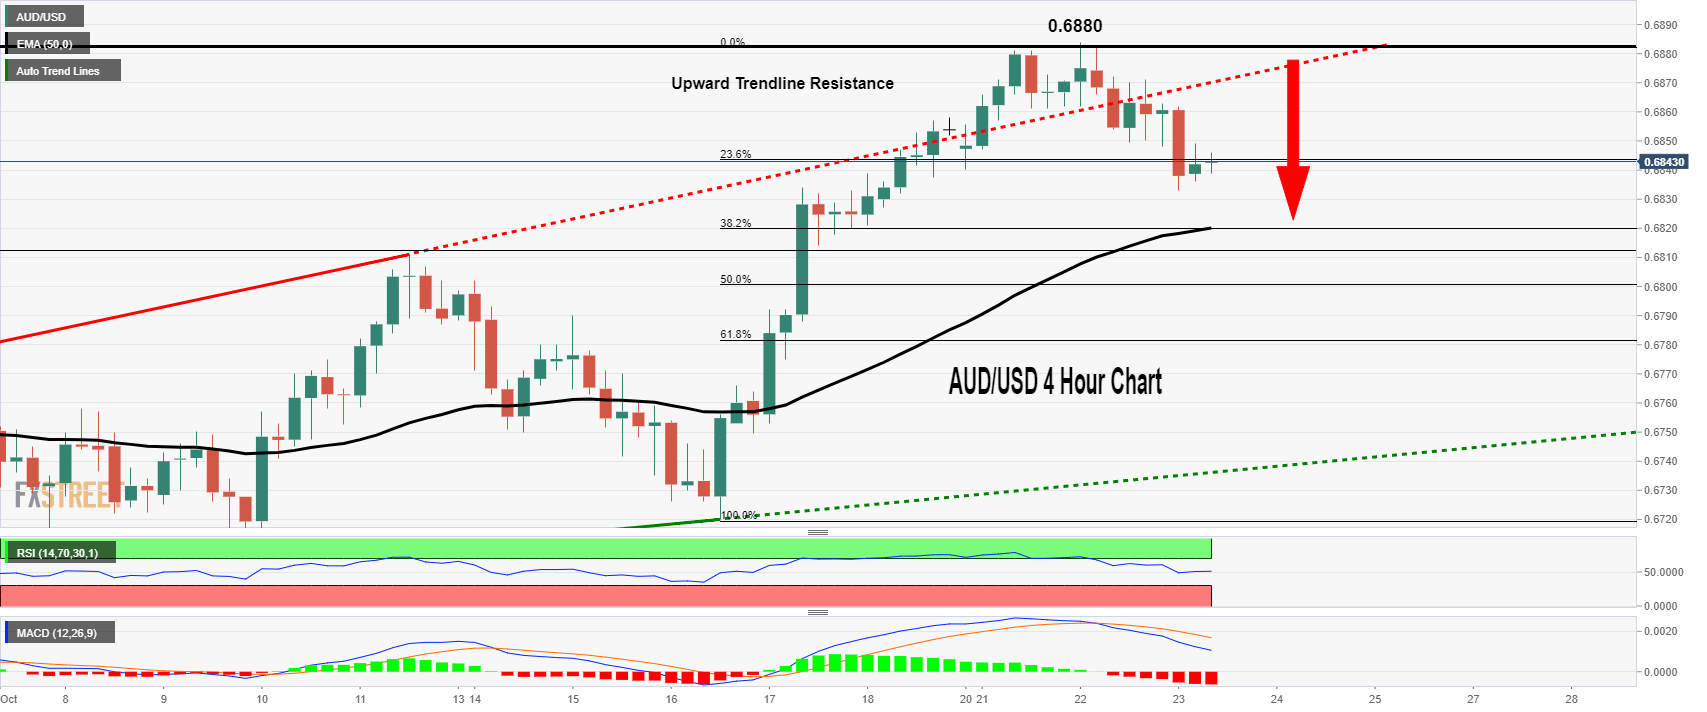
The AUD/USD closed at 0.68528 after placing a high of 0.68826 and a low of 0.68502. The overall movement for this pair remained Bearish that day. The Australian Dollar broke a 4-day streak of an upward trend on Tuesday. Even though the leading indicators of the Conference Board gave a positive sign, the Australian Dollar failed to hold its Bullish movement that day.
The US-China trade deal talks are faded from the news, and there are still chances for any disruptive trade issues to emerge in phase two deal of both countries. The reports that the American Department of Commerce ordered the antidumping duty and countervailing duty investigations on imports of cable and aluminum wire from China has raised the percentage of uncertainty related to trade disputes.
On the other hand, the release of positive Richmond Fed Manufacturing from the United States against the negative expectations gave strength to US Dollars on Tuesday. The US Dollar gains further from the Brexit news when its rival currencies Euro and Pound suffered from the rejection of Johnson's timetable in the UK Parliament on Tuesday. The weaker Aussie and stronger USD caused a decline in the prices of AUD/USD on Tuesday.
AUD/USD - Technical Levels
| Support | Pivot Point | Resistance |
| 0.6855 | 0.6868 | 0.6878 |
| 0.6845 | 0.6891 | |
| 0.6822 | 0.6914 |
AUD/USD - Daily Trade Sentiment
The AUD/USD rose to point a high nearby 0.6880 area, and under this level, the AUD/USD has formed a bearish engulfing pattern. This pattern can drive further selling until the 0.6820 area.
The 50 periods EMA holds at 0.6820, and that's the same level, which is extended by 38.2% Fibonacci retracement. Let's watch for selling trades below 0.6865 area to target 0.6820 today.
USD/CAD - Choppy Session Begins
The USD/CAD closed yesterday at 1.30935 after placing a high of 1.31227 and low of 1.30709. The overall movement for this pair remained Bullish that day.
The USD/CAD advanced to a fresh daily high on Tuesday after the shocking release of disappointing Core Retail Sales data of September. At 17:30 GMT, the Canadian Core Retail Sales reports came in as -0.2% against the expectations of 0.0%. Retail Sales also dropped to - 0.1% against the expectations of 0.4%.
The negative retail sales data from Canada made the Loonie weak and drove USD/CAD pair in the opposite direction in the beginning session of Tuesday.
However, after the news from OPEC came on board that they, along with their allies, were considering a deep cut of Crude Oil in December, the USD/CAD prices fell sharply. The supply cut from OPEC and its partners gave a sharp rise in the prices of Crude Oil on Tuesday, and hence, the commodity linked-Loonie also rose, which hurt the movement of USD/CAD.
The drop in USD/CAD was further supported by the weak macroeconomic release of Existing Home Sales from the United States. However, the USD/CAD managed to end its day with a slight Bullish candle.
-637074361421601495.png)
USD/CAD - Technical Levels
| Support | Pivot Point | Resistance |
| 1.307 | 1.3103 | 1.3125 |
| 1.3049 | 1.3158 | |
| 1.2994 | 1.3213 |
USD/CAD - Daily Trade Sentiment
The USD/CAD is trading sideways at 1.3098, having an immediate resistance at 1.3130 and support at 1.3060. Investors seem to wait for a fundamental reason to trade the USD/CAD.
The leading indicators like the RSI and MACD are tossing in red and green, suggesting a neutral bias for the pair. Consider trading bearish below 1.3130 and bullish above 1.3060 today. All the best for the U.S. session!
Author

EagleFX Team
EagleFX
EagleFX Team is an international group of market analysts with skills in fundamental and technical analysis, applying several methods to assess the state and likelihood of price movements on Forex, Commodities, Indices, Metals and


