Today’s Gold Upswing and Lessons from Gold Tops

What a classic day Friday was! Gold moved a bit lower, miners moved significantly lower, and silver rallied. Truly classic and outstanding performance if one enjoys seeing topping patterns that are playing out according to their usual and likely characteristics. And Monday’s early session seems to be an encore.
Let’s start with the examination of the most recent price action in gold.
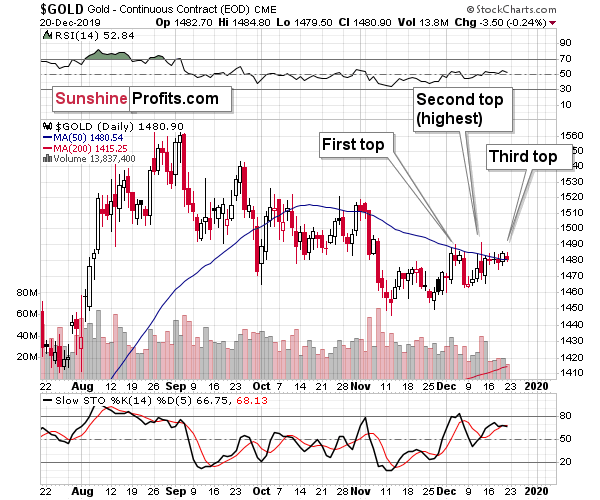
What we just saw could have been the final of the three tops that is then likely to be followed by the biggest decline of this quarter. That’s what gold seasonality in Q4 2019 supports too – we’re in for quite a volatile move lower before any short-term corrective upswing starts.
There’s one more thing about the gold chart to comment on. The above chart features in greater detail what happened recently, and the one below features the not-so-long-ago past – late-2018 price performance.
Lessons From Gold a Year Ago
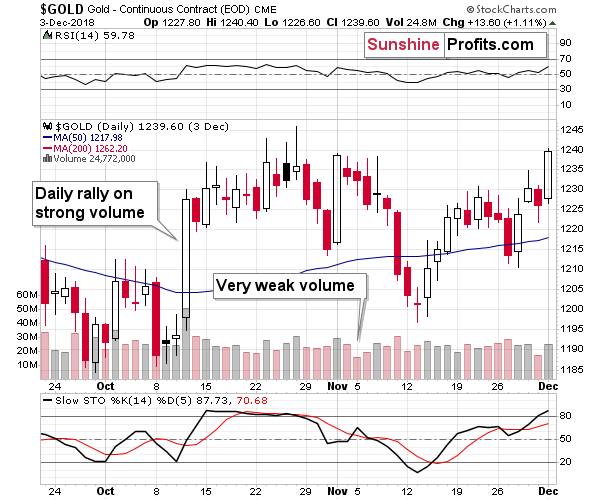
Both patterns started with a sizable daily rally in gold that took place on big volume (October 2018 and early December 2019). Then gold entered consolidation with a small breakout that was then invalidated. Gold recovered and went on to make the third attempt to break higher, but failed. What’s notable about these final attempts is that we saw a day with very low volume (early November 2018, and the last few days). Back in 2018, this pattern was followed by several days of visibly lower prices before gold rallied.
Something similar could – and is likely to – take place also this time. The end of the year is likely to mark a reversal, which means that gold could bottom at that time and start a corrective upswing. The difference this time is that the follow-up rally that would take place in January is not likely to be as sustainable as the one that started in mid-November 2018.
Having said that, let’s take a look at the silver market.
Turning to Silver
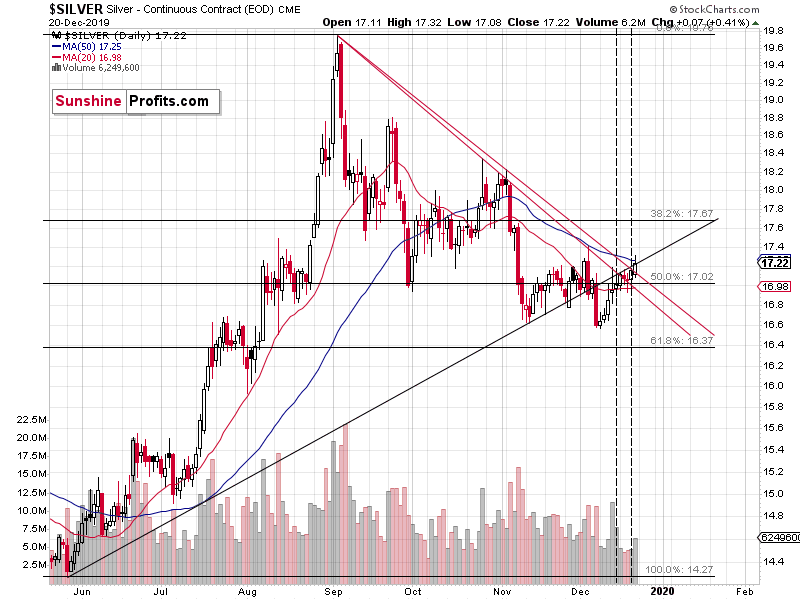
The white metal has indeed shown strength by rallying back to the rising resistance line and the 50-day moving average. It almost moved above the early-December high on Friday. It finally managed to break above it in Monday’s pre-market trading.
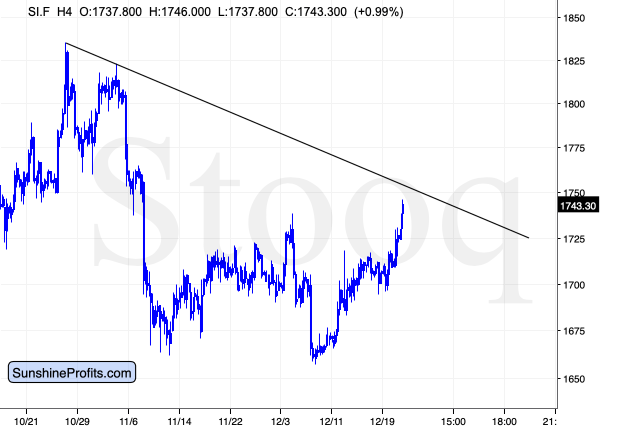
Silver has shown exceptional strength and soared to new monthly highs. This means that it also bro price action in gold e above its 50-day moving average and the rising resistance line. This would have been a very important and bullish development if…
If it wasn’t silver. The white metal can be counted on to provide fake signals over and over again, and one of the ways to tell if silver is likely lying is to look at what the rest of the precious metals market is doing. If gold is not breaking higher and if miners are underperforming, it’s very likely a fake move on silver’s part. The above is one of the most important trading tips for the gold market. There are many techniques that are universal, but this one is specific – and highly useful – in case of the PMs.
We already know what happened in gold – it didn’t break above the previous highs, at least at the moment of writing these words. And what about the gold miners?
The Miners’ Turn
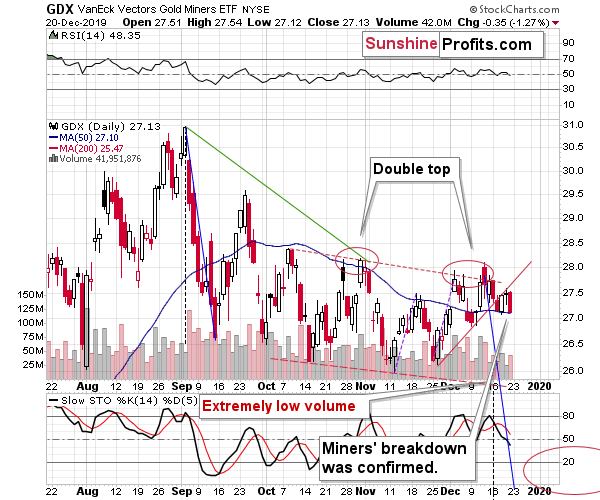
On Friday, miners confirmed their breakdown below the rising support line. It’s hard to imagine a clearer sign that silver’s breakout should not be trusted.
Remember the two, three tops in gold? In miners we can only see two of them, right? You know why? Because miners are already in the decline mode.
Just as it’s usually the case, miners were the first to rally and silver was catching up. Again, that’s a classic topping performance in the precious metals market.
The dynamics of other precious metals’ sectors or the lessons from their seasonality are far from the only defining elements in gold price development. The USD Index moves and the key factors at play are another important pieces of the puzzle. This is what the full version of the analysis covers – plus the targets of our promising short position. We encourage you to join our subscribers and reap the rewards.
Want free follow-ups to the above article and details not available to 99%+ investors? Sign up to our free newsletter today!
Want free follow-ups to the above article and details not available to 99%+ investors? Sign up to our free newsletter today!
Author

Przemyslaw Radomski, CFA
Gold Price Forecast
Przemyslaw Radomski, CFA (PR) is a precious metals investor and analyst who takes advantage of the emotionality on the markets, and invites you to do the same. His company, Sunshine Profits, publishes analytical software that any