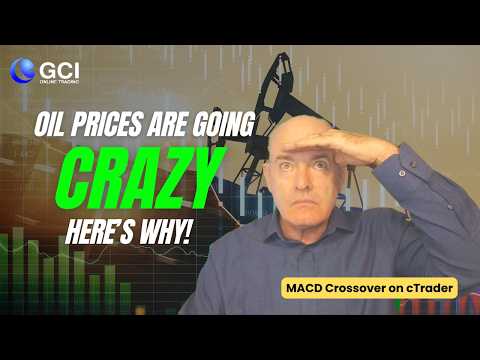
Three reasons why WTI and Brent Crude are flying, forex trading XAU/USD at key fibonacci level [Video]
![Three reasons why WTI and Brent Crude are flying, forex trading XAU/USD at key fibonacci level [Video]](https://editorial.fxsstatic.com/images/i/West-Texas-Intermediate_2.png)
In today’s Market Outlook, let’s take a look at Forex Trading on USDCAD, Silver, XAGUSD, Gold, XAUUSD, Brent Crude, and WTI Crude Oil.
We can see that the last two days of price action have been quite bullish in the Crude Oil Market.
Why is that?
Inflamed geopolitical tensions between the U.S. and Iran are raising fears of possible supply disruptions, especially around the Strait of Hormuz, which is a major oil transit route.
There is a build-up of U.S. military assets, and faltering diplomatic progress has affected the perceived risk of conflict.
U.S. crude inventories fell more than expected, tightening the near-term supply backdrop.
We can see from today’s Inventory report that supply was down by 9 million barrels, which contradicts the forecast of an increase of 1.7 million barrels.
If you are new to crude oil trading, WTI is West Texas Intermediate weight crude oil mostly from Texas and other states.
Brent Crude Oil comes from the North Sea between Britain and Norway.
Brent is always more expensive than WTI, mostly because of supply and demand issues based on logistics and the global popularity and ease of transportation of Brent.
We talked about the price of Gold XAUUSD last time, and we see price action at almost exactly $5,000 at the 50% Fibonacci level.
We see support at the 38.2% Fib level, but regardless, we need to see a break above or below.
We are also seeing a flat MACD and an undecided Stochastic Oscillator, so the technicals aren’t really helping us.
For you Fibonacci fans, Silver XAGUSD is looking identical on the technicals, and Fib levels are quite important as well.
Downward pressure on precious metals may come from the USD, which is getting stronger across the board.
The Fed is hinting at an Interest Rate increase, as inflation remains a problem, which will always bolster price action on any currency.
Last time, we looked at the cTrader MACD Histogram.
The MACD Crossover is similar, and it is up to the individual trader to determine which one works for you.
You will note that the red Signal Line is the same on both.
Reversals can be spotted on both with the signal line passing out of the histogram or crossing the MACD Line.
You will also note that the Yellow MACD Line corresponds with the peaks of the MACD Histogram.
So, that leaves the histogram on the MACD Crossover indicator, which reacts much more quickly to bullish and bearish price action.
That’s all for now.
CFDs and FX are leveraged products, and your capital may be at risk.
Author

Brad Alexander
FX Large Limited
Brad became fascinated with the Currency Markets from a young age and researched fundamental analysis.


