Three price drivers in a globalized world

Do you want to know how gold will be doing soon? Or the USDX? You have to look at the German and French economies. You may ask "What? How can they be tied together?" Well, the globalization of markets is one of the core foundations of the modern world. With everything interrelated, nothing in economics can be examined in a vacuum state. That includes the three precious metals price drivers: stocks, yields and currencies.
The EUR/USD currency pair is a perfect example of this interconnectivity. Being the most popular and most traded currency pair in the world, the EUR/USD is influenced by many factors, including the price action in the USD Index as well as the strength of the European and American economies at any given time. The same level of interconnectedness can be applied to the other price drivers.
Let's take a fundamental look at stocks, yields and currencies.
As you can see in our Correlation Matrix, the 30-trading-day correlation values are strongly negative in the case of all key parts of the precious metals market (gold, silver, senior miners, junior miners) and the USD Index, while they remain generally positive in case of the link with the stock market. Both links are most visible when we take the 250 trading days into account (effectively about 1 year).
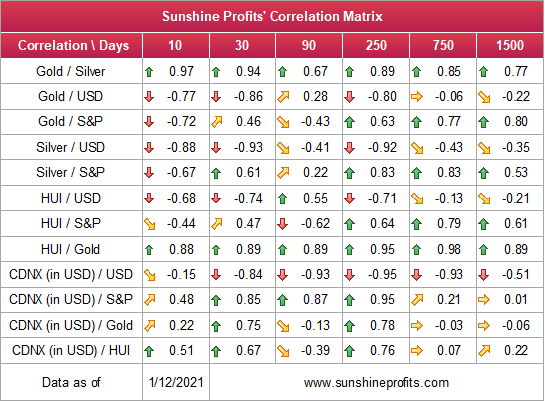
The closer to -1 the number gets, the more negatively correlated given assets are, and the closer to 1 it gets, the stronger the positive correlation. Numbers close to zero imply no correlation.
So, what do these markets tell us about future movements in the price of gold?
Future History
Yesterday, I highlighted the record excess that's building up across U.S. equities. And as we approach the middle of January, investors are giving new meaning to Paul Engemann's Push It to the Limit.
Last week, the S&P 500's option Gamma (21-day moving average) reached the top 0.37% of all-time readings. And on Monday (Jan. 11), the 10-day MA set a new record.
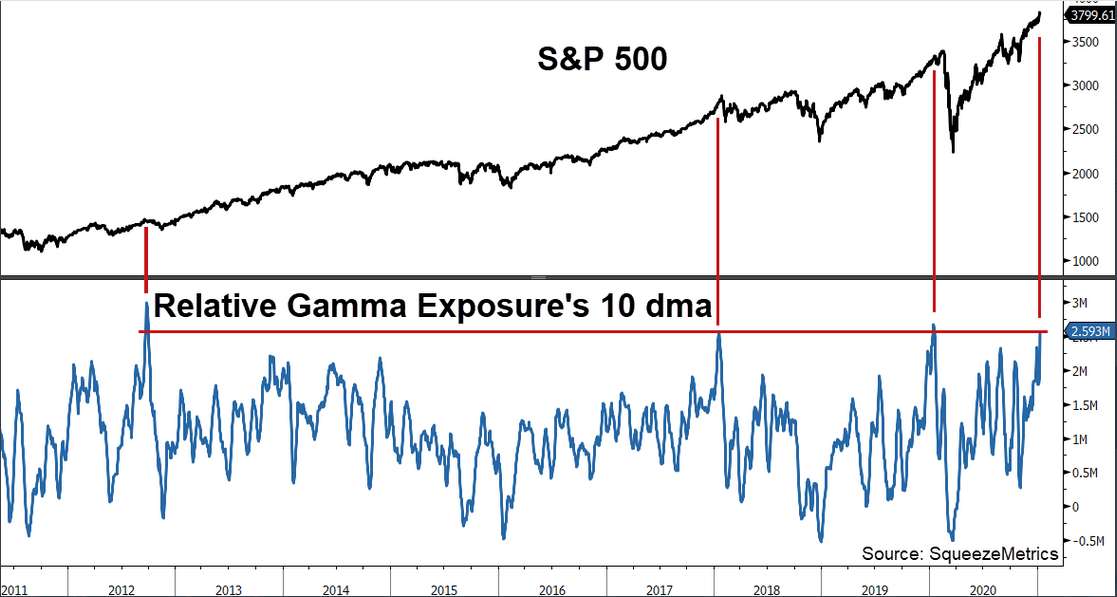
Keep in mind, Monday's record was set on an absolute basis (by analyzing the number of outstanding options contracts). However, relative to the S&P 500's market cap (which biases the reading lower as stocks move higher), it's the fourth-highest since 2011. More importantly though, the last three times Gamma exposure reached the current level, the S&P 500 fell by 7.9%, 7.3% and 31.0% over the following two months (the vertical red lines above).
From a valuation perspective, the derivatives frenzy has also helped push the NASDAQ (4.17x), S&P 500 (2.85x) and Russell 2000's (1.49x) price-to-sales (P/S) ratios to their highest levels ever.

And a day after the milestones were set, U.S. small business confidence (the NFIB Small Business Optimism Index) fell to a seven-month low (Jan. 12).
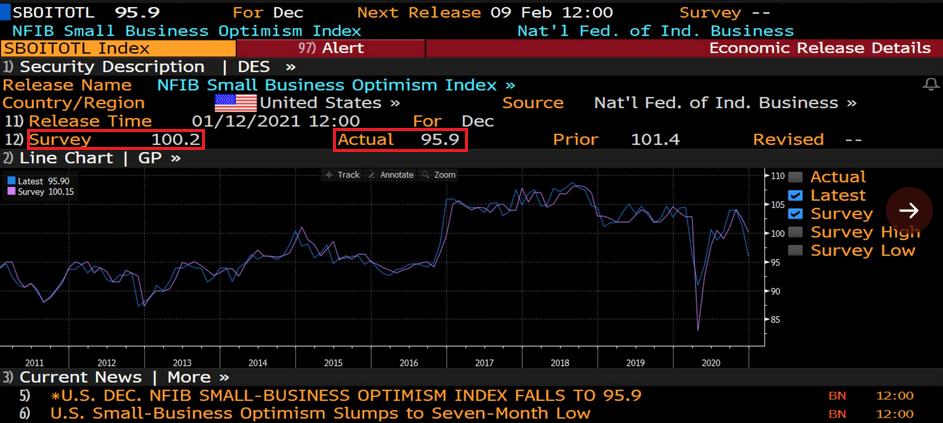
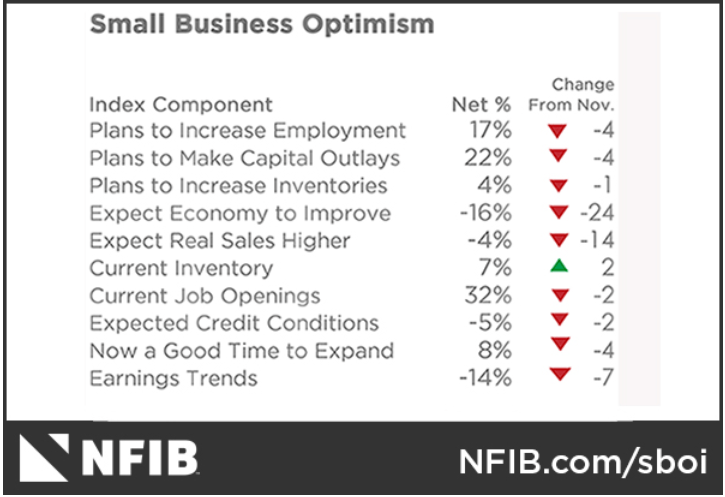
In addition, while economists expected a print of 100.2 (the red box on the left), the reading came in at 95.9 (the red box on the right), more than two points below the index's historical average. Furthermore, nine out of 10 survey categories indicated that economic conditions are worse than they were in November.
As another wonder to marvel at, U.S. Treasury yields are also surging (which I've mentioned during previous editions). And because corporate profits are still on life support (due to the lack of real economic activity), the spread between the S&P 500's earnings yield and the U.S. 10-Year Treasury yield just hit its lowest level in over two years.
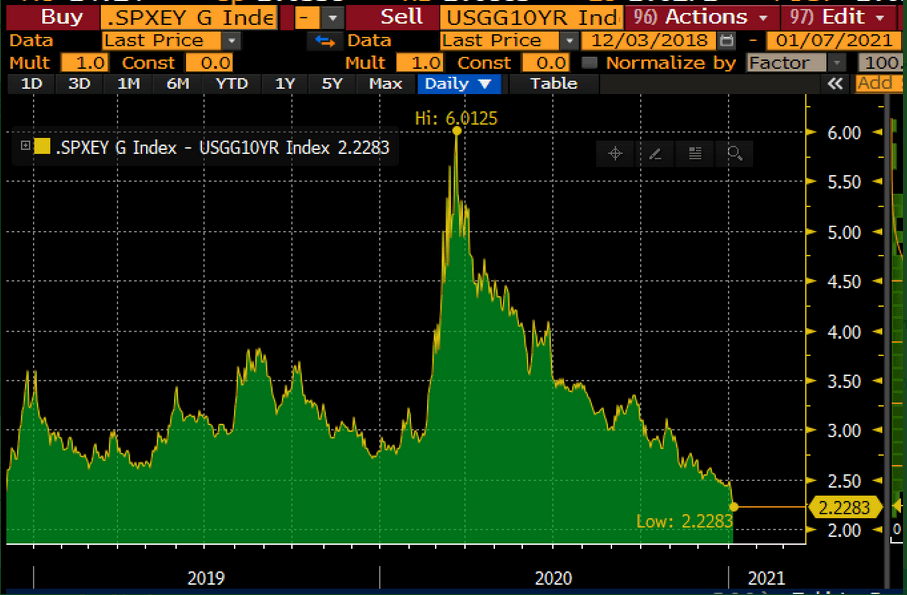
To explain, the earnings yield is the inverse of the S&P 500's price-to-earnings (P/E) ratio (calculated as earnings divided by price). The percentage is often compared to the yield on the U.S. 10-Year Treasury to gauge the relative value of stocks versus bonds. If you look at the middle of the chart, you can see that the spread between the two peaked at more than 6% in 2019 (as companies' EPS rose and bond yields fell). However, with the opposite occurring today, the spread between the two has fallen below 2.23%.
Thus, with bond yields beginning to breathe new life, Jerome Powell's (Chairman of the U.S. Federal Reserve) argument that P/E multiples are "not as relevant" in a world of low interest rates is starting to lose its luster.
EUR/USD Struggles with Reality
Despite bouncing yesterday (as declines rarely happen linearly), the EUR/USD is still treading fundamental water.
Over the last few weeks, I've been highlighting the increased economic divergence – as a weak U.S. economy is overshadowed only by an even-weaker Eurozone economy (Remember, currencies trade on a relative basis.)
And as another data point of validation, yesterday, Bloomberg Economics reduced its first-quarter GDP forecast (for Europe) from a rise of 1.3% to a decline of 4.0%. Furthermore, the team also reduced their full-year GDP growth forecast from 4.8% to 2.9%.
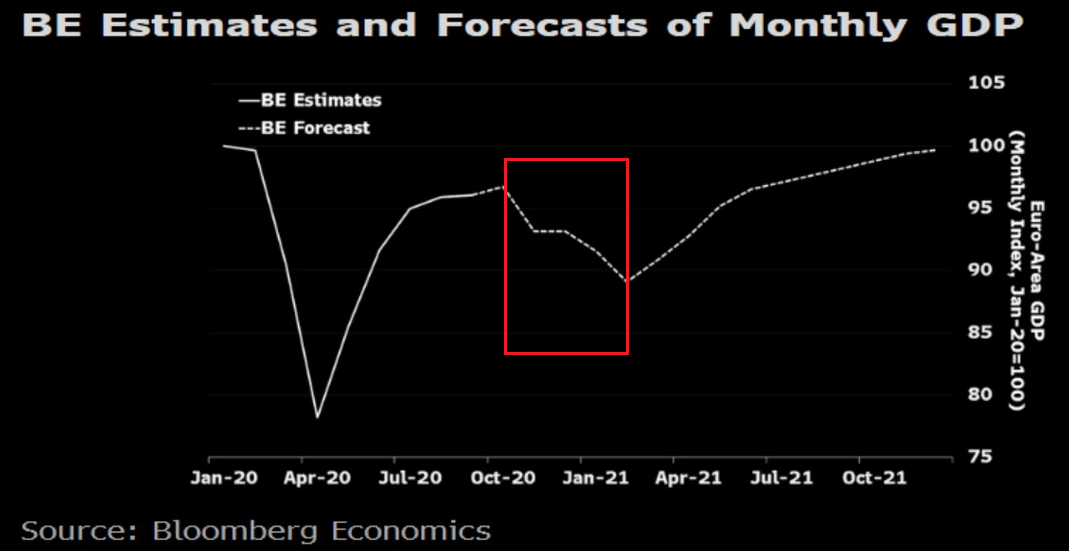
If you analyze the red box, you can see the massive drop in economic activity that's expected during the first three months of 2021. And even more pessimistic, Peter Vanden Houte, ING's Chief Economist wrote (on Jan. 7) that he believes "it will take until the summer of 2023 for the Eurozone to regain its pre-crisis activity level."
Also plaguing Europe, please have a look at the sharp decline in the Eurozone household savings rate:
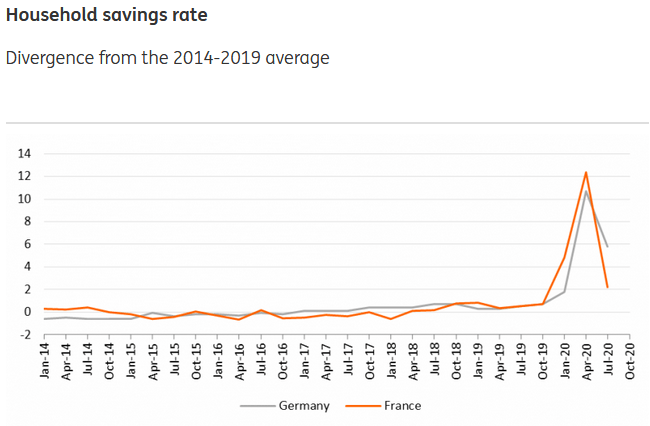
To explain, the huge spike in 2020 was a function of government programs to replace lost wages at the onset of the pandemic . However, as the crisis unfolded and the level of government spending became unsustainable, the household savings rate in Germany and France (Europe's two largest economies) sunk like a stone.
Moreover, with Eurozone retail sales plunging by 6.1% in November, and assuming the household savings rate followed suit, you can infer that households are allocating resources to necessities and not discretionary items that boost GDP.
The bottom line?
The European economy is underperforming the U.S. economy and the deluge of bad data is slowly chipping away at the euro. And as the fundamental damage continues, the EUR/USD should come under pressure and help propel the USD Index higher.
As part of the fallout, gold will likely drop below its rising support line and then decline further. Once it bottoms, we'll have a very attractive entry point to go long in the precious metals and mining stocks.
Want free follow-ups to the above article and details not available to 99%+ investors? Sign up to our free newsletter today!
Want free follow-ups to the above article and details not available to 99%+ investors? Sign up to our free newsletter today!
Author

Przemyslaw Radomski, CFA
Sunshine Profits
Przemyslaw Radomski, CFA (PR) is a precious metals investor and analyst who takes advantage of the emotionality on the markets, and invites you to do the same. His company, Sunshine Profits, publishes analytical software that any


