The USD fell on Ukraine’s success news – How did gold react?

Ukraine's military successes in the war with Russia had a negative impact on the dollar. At the same time, gold didn’t benefit as much as it could.
Looking at an individual tree (daily session) is exciting. Especially if the tree (profits on a trade) is growing day by day. However, it is looking at what the forest (the broad perspective, general trends) does that makes one’s portfolio grow over time.
Two keys
While I provided a lot of context in Friday’s flagship analysis, in today’s analysis, I will focus on two key long-term developments that are extremely important but that don’t get enough emphasis.
The first one is in gold stocks, and the second is in the USD Index.
Starting with the latter, the key thing is that the USD Index is after a breakout above the previous highs, and while it just invalidated the short-term breakout, it continues to trade in a mirror-like pattern to what happened in 2002 and 2003.
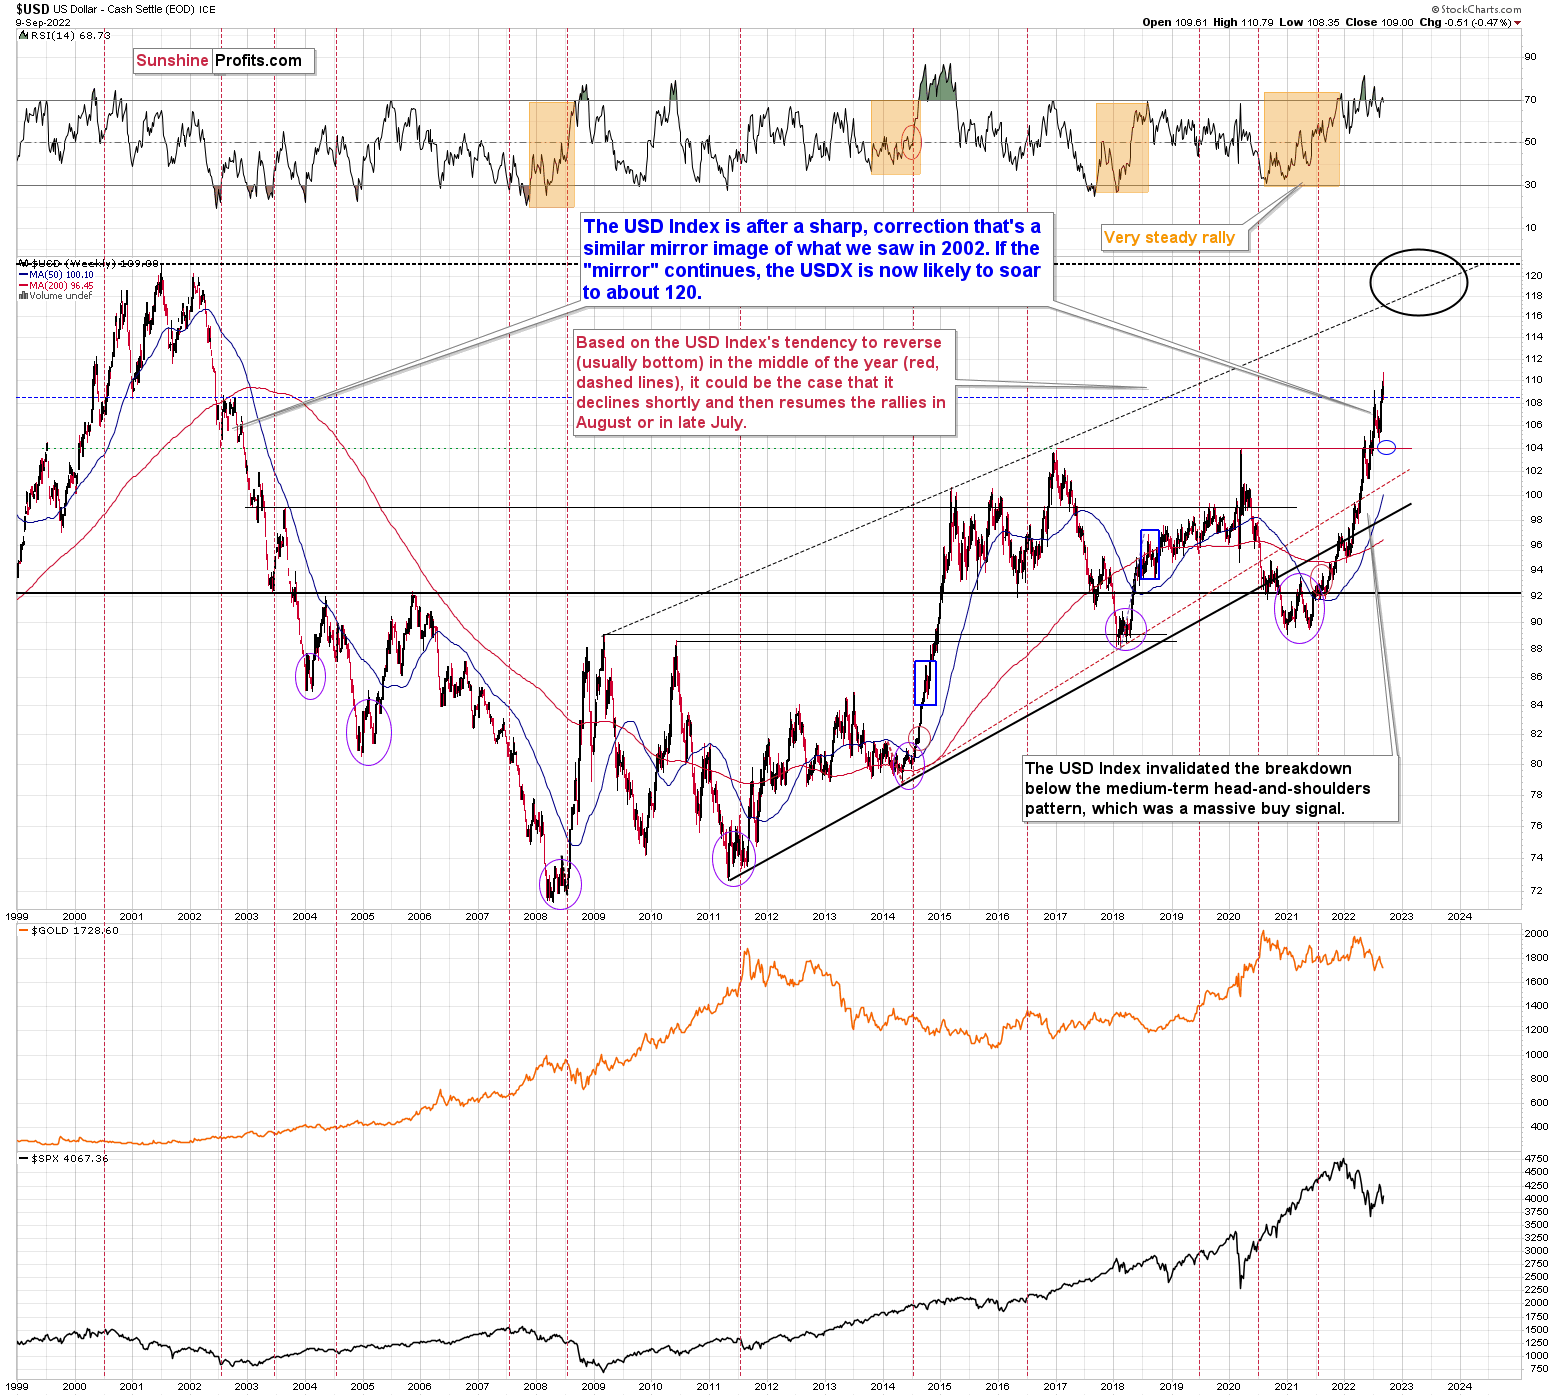
Back then, the corrective pause took quite a while before the movement continued. Due to sharply rising interest rates, it doesn’t have to be the case this time . However, even if the USD Index once again moves to the 104-105 area, the medium-term outlook will still remain very bullish.
Is it likely to happen?
Not necessarily.
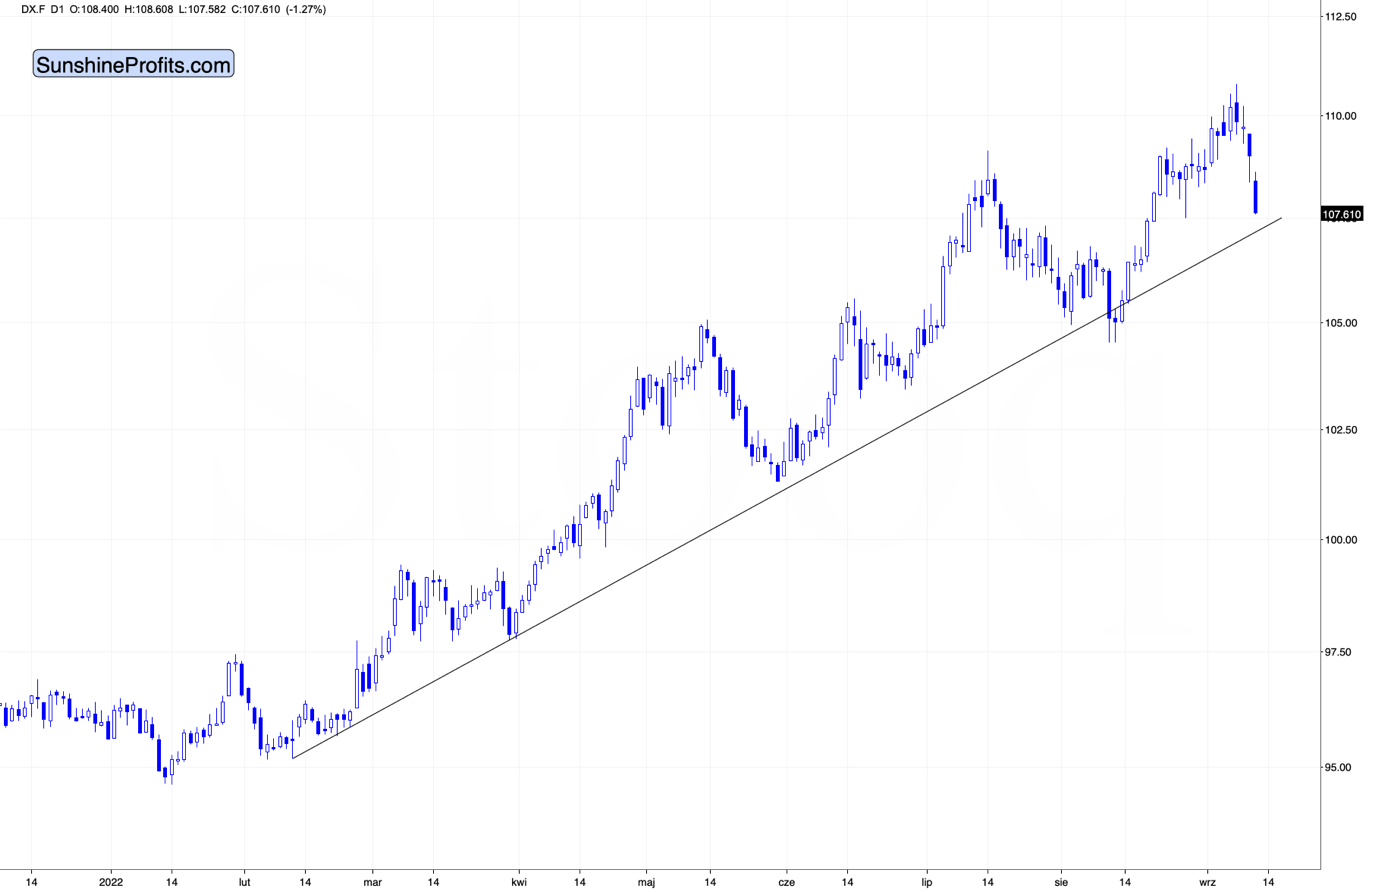
From the short-term point of view, the USD Index declined substantially today (likely the safe-haven demand decline based on the counter-offensive in Ukraine, which suggests that the war might be close to its end, and Russia could be on the losing side thereof), and it’s about to reach its rising support line.
This line kept the declines in check for months, so it’s quite likely that it will stop the declining prices also this time.
While the USD Index declined substantially in today’s pre-market trading (about 1.2%), did gold’s price rally substantially?
No. It’s up by just 0.38% so far today. (And silver’s price is up by over 1.6%, which means that it’s outperforming gold on an immediate-term basis – something that we often see right before bigger declines.)
So, we have a situation where gold doesn’t really want to rally based on the USD’s decline, and that’s bearish for gold, especially since the support for the USD Index appears to be just around the corner.
Also, regardless of the immediate-term effects on forex prices, please consider the following. If the situation in Ukraine stabilizes and things get back to the way they were before, at least in terms of borders (or Ukraine claims Crimea back), it means undoing a lot of what happened based on those changes in the past, right? And gold rallied in response to both events – the invasion of Crimea and the invasion of the rest of Ukraine. So, it could decline as things stabilize – mainly because the safe-haven demand wanes.
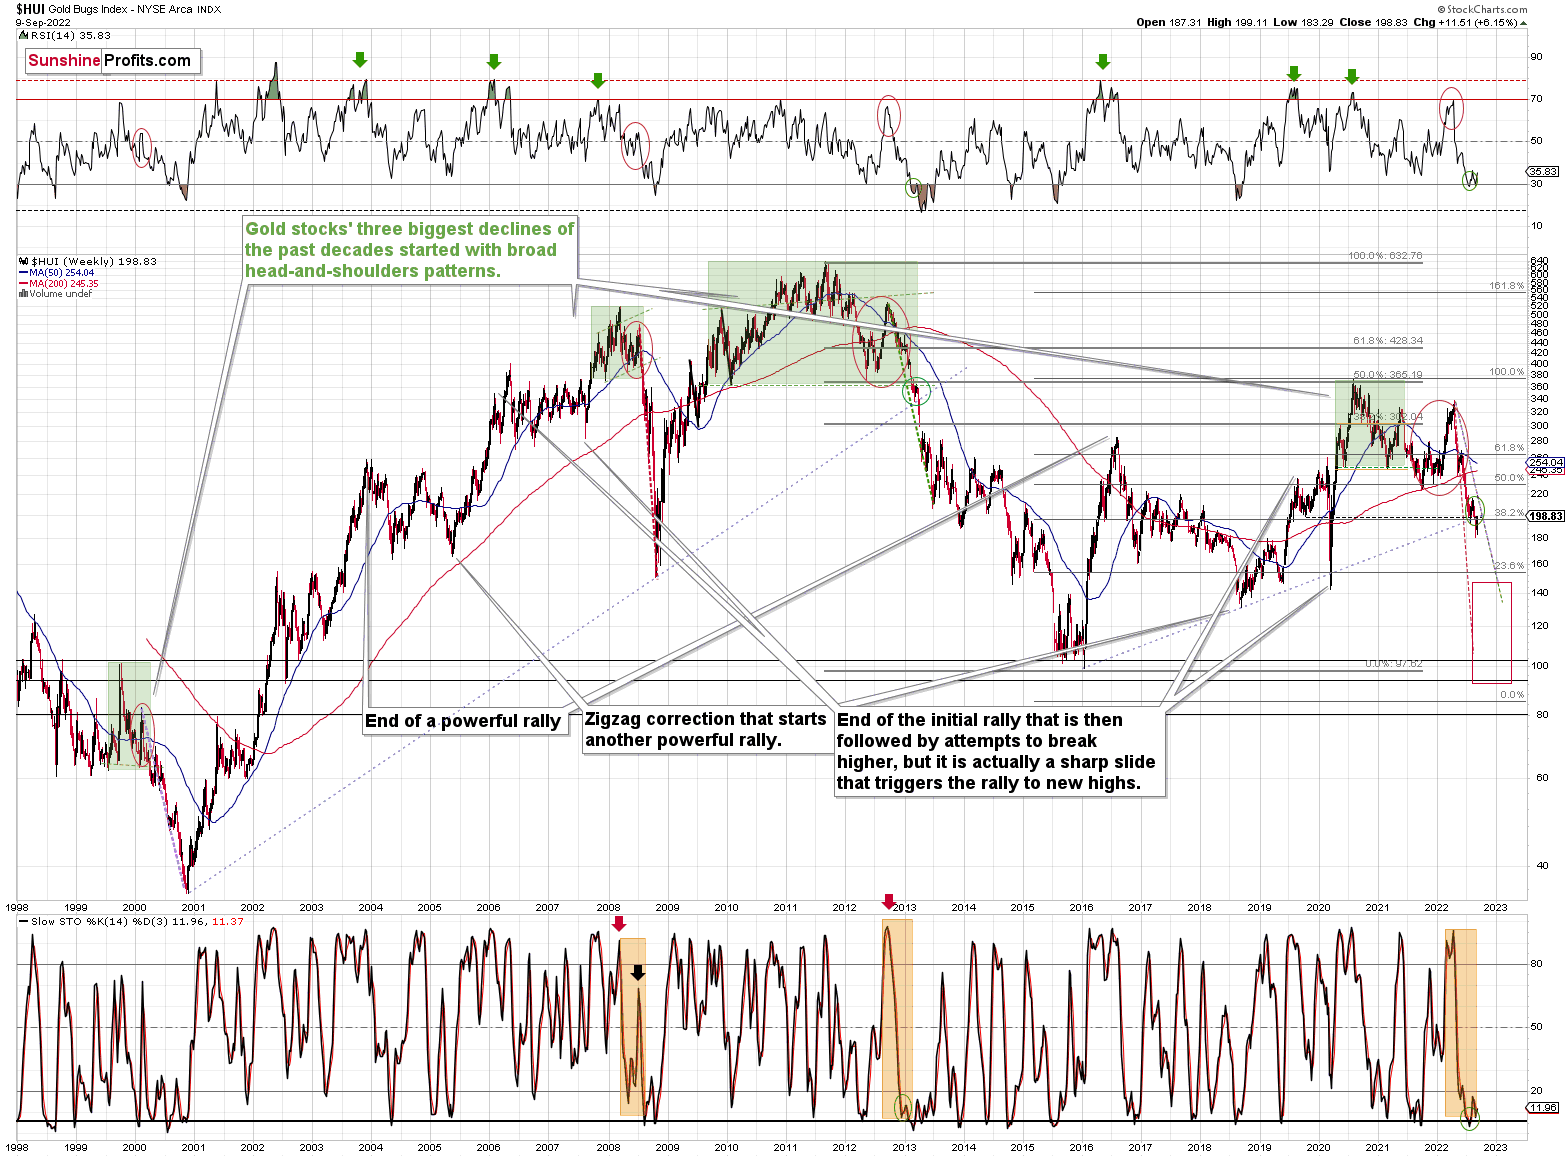
The second big thing that I want to feature today is the situation in the HUI Index. I like to analyze this index as it’s been trading for a long time, and therefore it’s able to provide a lot of context to the most recent price moves.
Here we go again?
In this case, what I would like to emphasize is that the key breakdown is below the rising long-term support line that’s based on the 2016 and 2018 lows.
Back in 2020, the breakdown below this line was quickly invalidated. This time, it’s the opposite. The breakdown was confirmed.
The very recent move higher simply means that gold stocks are verifying the breakdown. Nothing more.
It is the huge decline that we saw this year that is what is really going on, and by focusing on just the last several trading days, one might completely miss the perspective. The big deal about gold stocks right now is that they are in a medium-term decline, not that they bounced recently.
As far as gold itself is concerned, it continues to correct from approximately its previous lows, which is exactly what we saw in 2013 right before the biggest part of the slide. I was there. I remember what the overall feeling among the investors back then was. The narrative was “the bottom is in, the rally will now surely resume, it’s a no-brainer”. Then gold plunged.
Nothing from what we saw recently (including today) invalidated this analogy. The outlook remains extremely bearish.
Want free follow-ups to the above article and details not available to 99%+ investors? Sign up to our free newsletter today!
Want free follow-ups to the above article and details not available to 99%+ investors? Sign up to our free newsletter today!
Author

Przemyslaw Radomski, CFA
Gold Price Forecast
Przemyslaw Radomski, CFA (PR) is a precious metals investor and analyst who takes advantage of the emotionality on the markets, and invites you to do the same. His company, Sunshine Profits, publishes analytical software that any


