The stock upswing is living on borrowed time

The SP 500 upswing just couldn’t carry on. Friday’s action marks an inside bar as neither the daily high or low exceeded that of Thursday’s session. That’s a textbook example of indecision that doesn’t offer much in terms of additional clues, right? Wrong, as both the context and shape of Friday’s candle abound in hints for upcoming sessions. Not to mention the fundamental interpretation of Friday’s actions…
Let’s start today’s analysis with the weekly chart examination (chart courtesy of stockcharts.com).
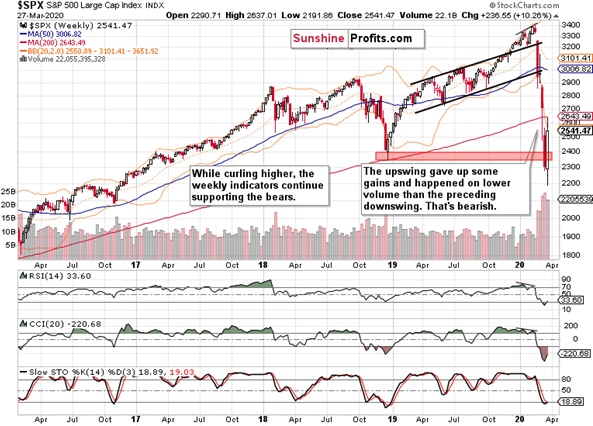
Prices invalidated their breakdown below the red support zone marked by the December 2018 lows. But this invalidation was marked by lower volume compared to the preceding breakdown, and was also accompanied by the bulls giving up a sizable part of their weekly – not to mention last Monday’s push lower, which created a comparably large lower knot.
This points to the conclusion that the breakdown invalidation is far from a foregone conclusion. This is also supported by the weekly indicators still leaning bearish – regardless of the Stochastics buy signal or the RSI leaving the oversold territory. It’s that the preceding selling has been heavy, last week’s bearish gap remains unclosed, and last week’s bullish candle doesn’t outweigh that – especially since its momentum waned on Friday.
But we got the $2T stimulus passed, so stocks should have rallied. Unfortunately, they’ve been unable to defend their gains, and the S&P 500 futures closed down on the day. The below daily chart shows it all.
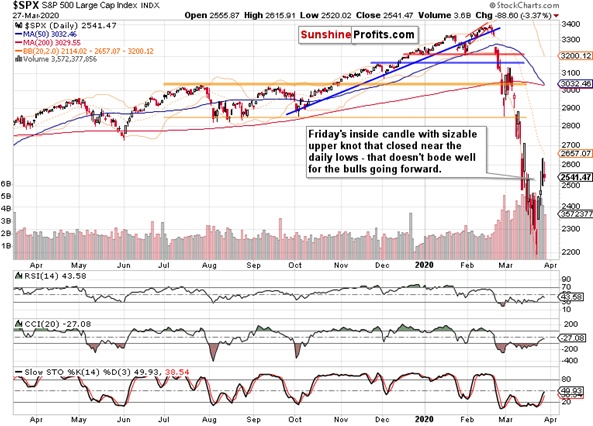
Friday’s candle is an inside candle, and despite the teasing question in the opening paragraph, it is indeed rich in indications. Its shape is bearish thanks to the large upper knot and prices closing near the daily lows. As the daily volume was lower than that on preceding up days, thus marking the bears’ unwillingness to participate heavily in a reversal so far, we might still get another attempt to move higher.
But that’s unlikely to overcome Thursday’s highs in any lasting way, in our opinion. The pace of RSI and CCI rise is already weakening after they both reached their mid-range readings. While Stochastics is still on a daily buy signal, that can change pretty fast – even with a couple of days’ sideways action only.
But still, we expect the return of the bears in the coming sessions as the most likely scenario.
Let’s recall our Friday’s observations as they’re still valid today:
(…) The fundamental one is not much more supportive of the bulls. On the coronavirus front, there have been no really good news coming from the US lately, and the Fed and fiscal moves to alleviate its impact have been discounted in the prices already.
Despite the tremendous stimulus, stocks are not responding very proportionately. Stating the obvious, this tells us the problem is not of a monetary or fiscal policy nature. After yesterday’s almost 3300K initial unemployment claims, what will be next week’s tally? Much depends on the policy steps taken and tradeoffs chosen. Either way, the fundamental outlook for stocks isn’t bullish right now.
There’s one more reason to hold the bearish view. Take a look at this high-yield corporate debt chart (HYG ETF).
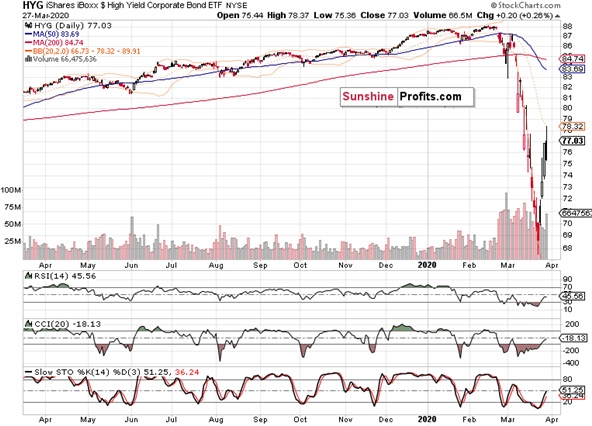
The recent rally that went hand-in-hand with the S&P 500 and SPY ETF upswing, appears to have run into stiff headwinds. Just like credit spreads – but the HYG chart shows the increasing participation of the sellers on top of very similar positioning of daily indicators relative to S&P 500. Once again, this doesn’t bode well for stocks ahead, because we’re likely to get another leg higher in the risk-off trade. In other words, the market isn’t convinced the recent extraordinary policy steps will mark a turnaround.
Summing up, despite the weekly chart’s price action, the bears still have the upper hand. While the temporary upswing has run into stiff headwinds on Friday, it can still retrace a part of today’s premarket decline but don’t bet your farm on that. The time for the rally is running out, as both the daily indicators and high-yield corporate debt charts show. Considering the risk-reward perspective, our currently open short position remains justified, as we’re looking for a fifth winning trade in a row to grow our 646-point gain since the February Stock Trading Alerts relaunch (out of which, 340-point profit came in the last five trading days).
Want free follow-ups to the above article and details not available to 99%+ investors? Sign up to our free newsletter today!
Want free follow-ups to the above article and details not available to 99%+ investors? Sign up to our free newsletter today!
Author

Monica Kingsley
Monicakingsley
Monica Kingsley is a trader and financial analyst serving countless investors and traders since Feb 2020.