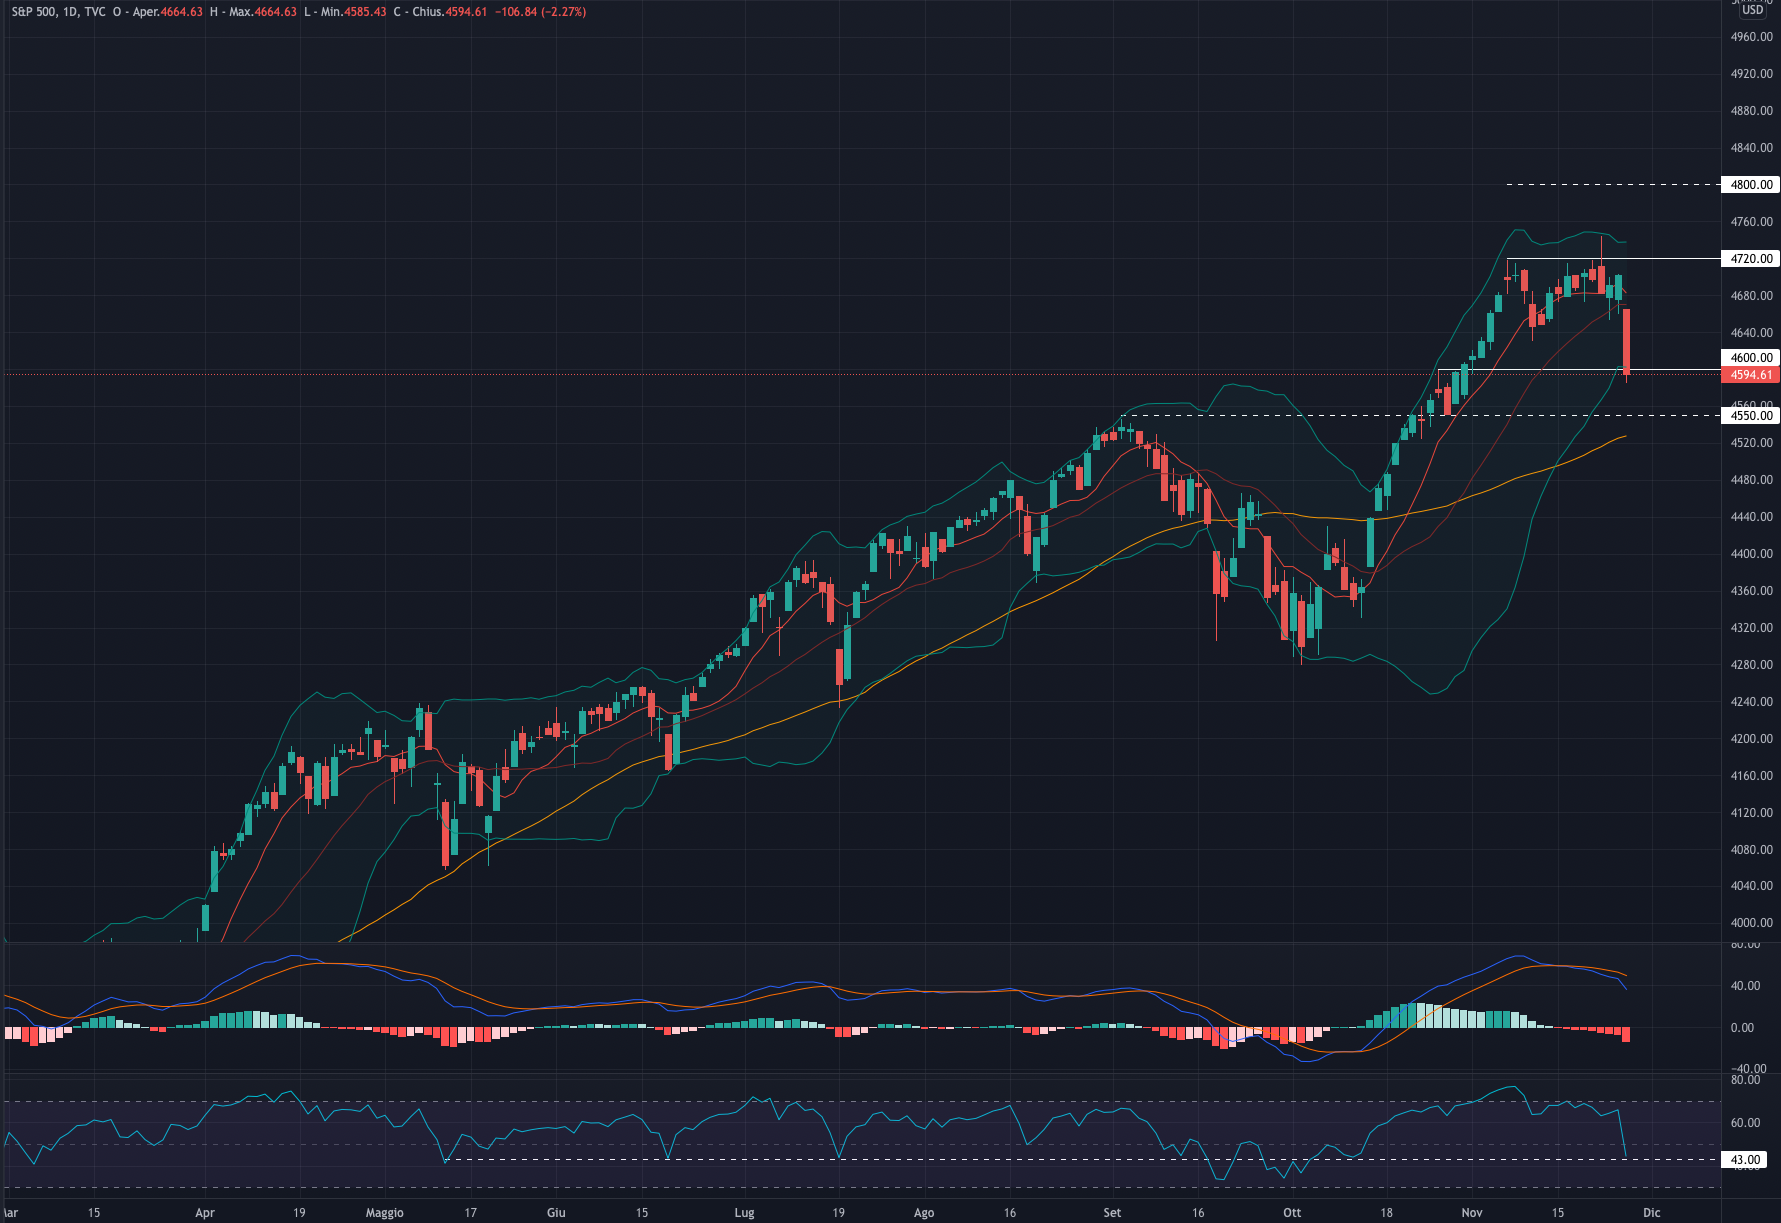
The S&P 500 tested the intermediate support at 4,600

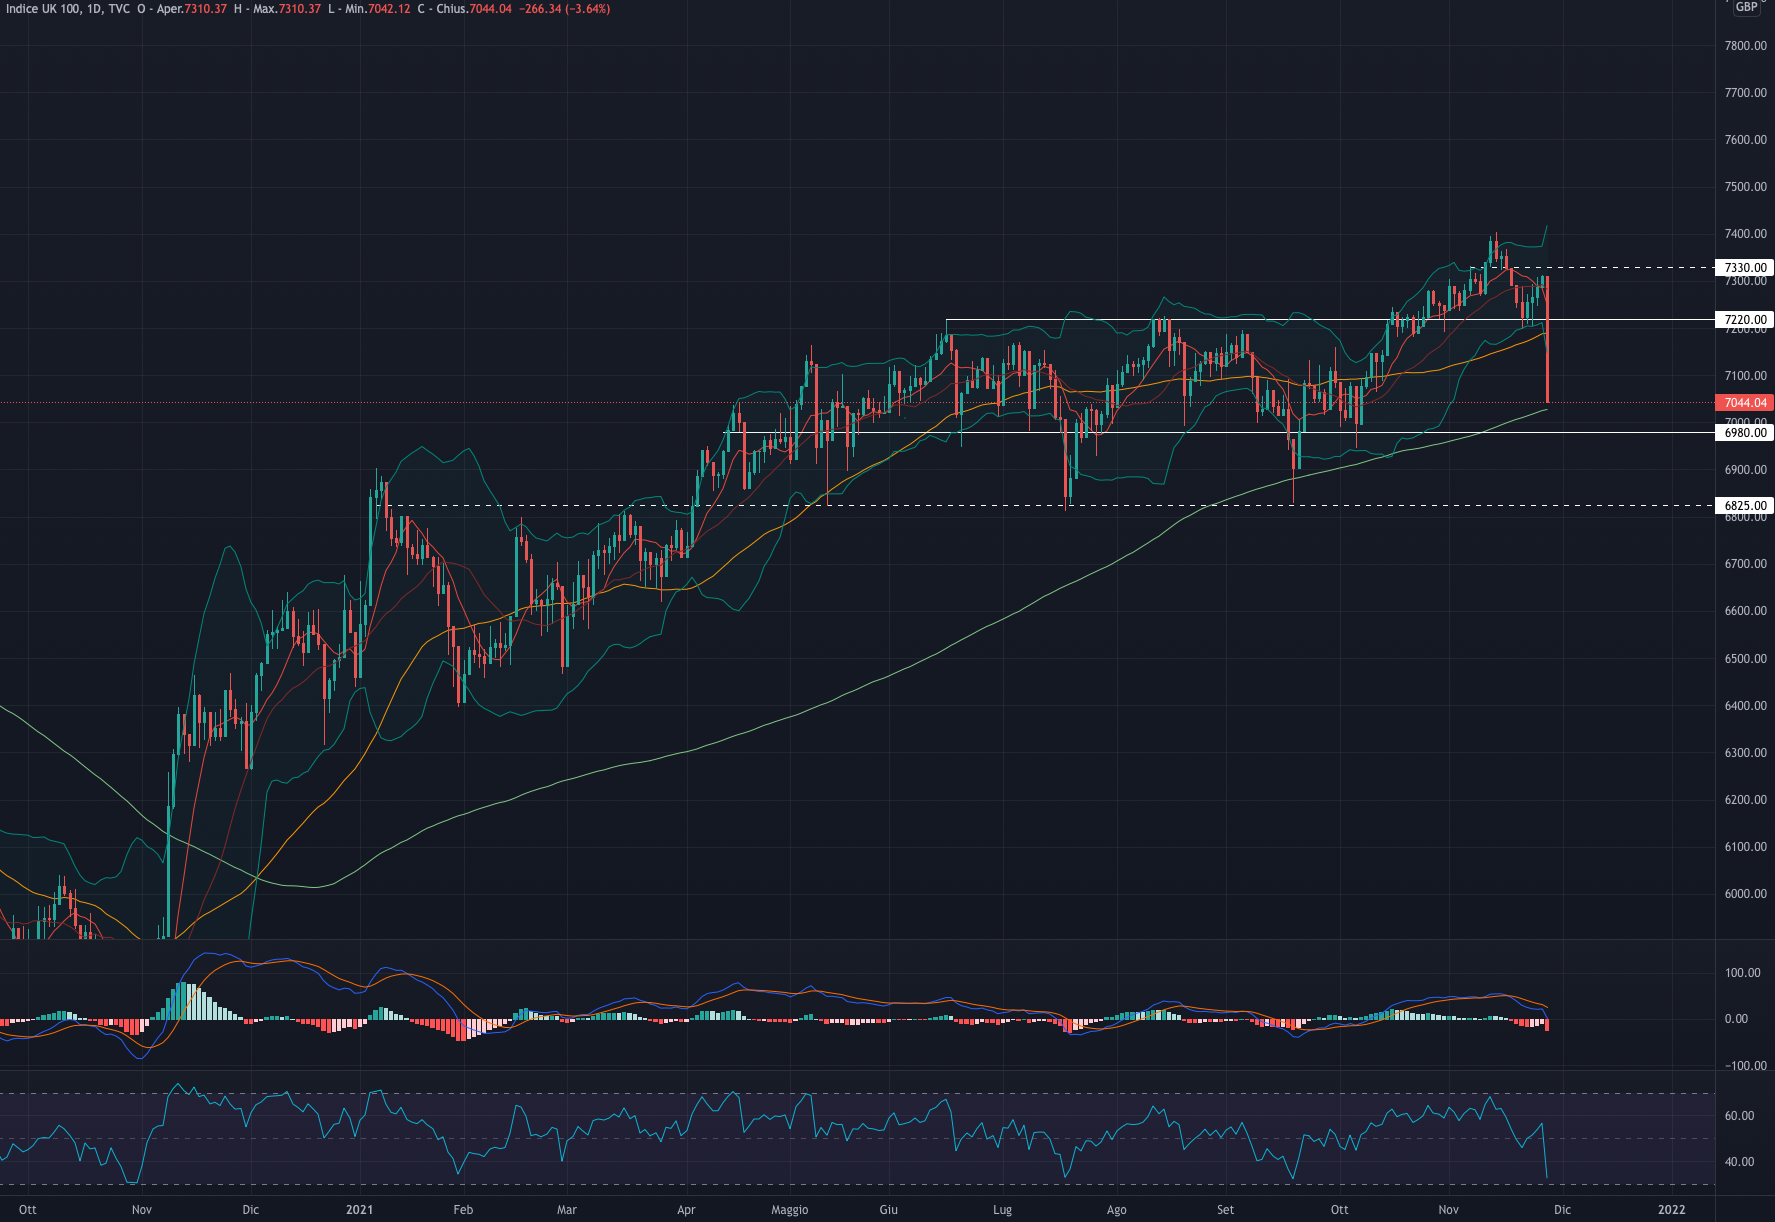
FTSE 100 (#UKX)
The FTSE 100 ended the week down -2.85%.
For the week we expect a possible consolidation between 7,050 and 6,980.
Indicators
After retesting the 7,300 level, the index sold off on Friday reaching what we consider a strong support area.
Given the very bearish candle on Friday, at the beginning of the week, the index could continue the downside and test the current support at 6.980.
We believe that once the bearish continuation is over, the index will consolidate and then aim for recovery at least up to the 50MA.
MACD, still remains above 0 but it is the RSI that is supporting the theory of a possible recovery: in fact, the indicator has almost reached the oversold area and looking at previous swings this has led to positive bullish recoveries in the short term.
The trend remains intact and this latest decline could serve as an excellent basis for a bullish recovery, a scenario also supported by the 200MA.
Support for 6.980.
Resistance at 7,220.
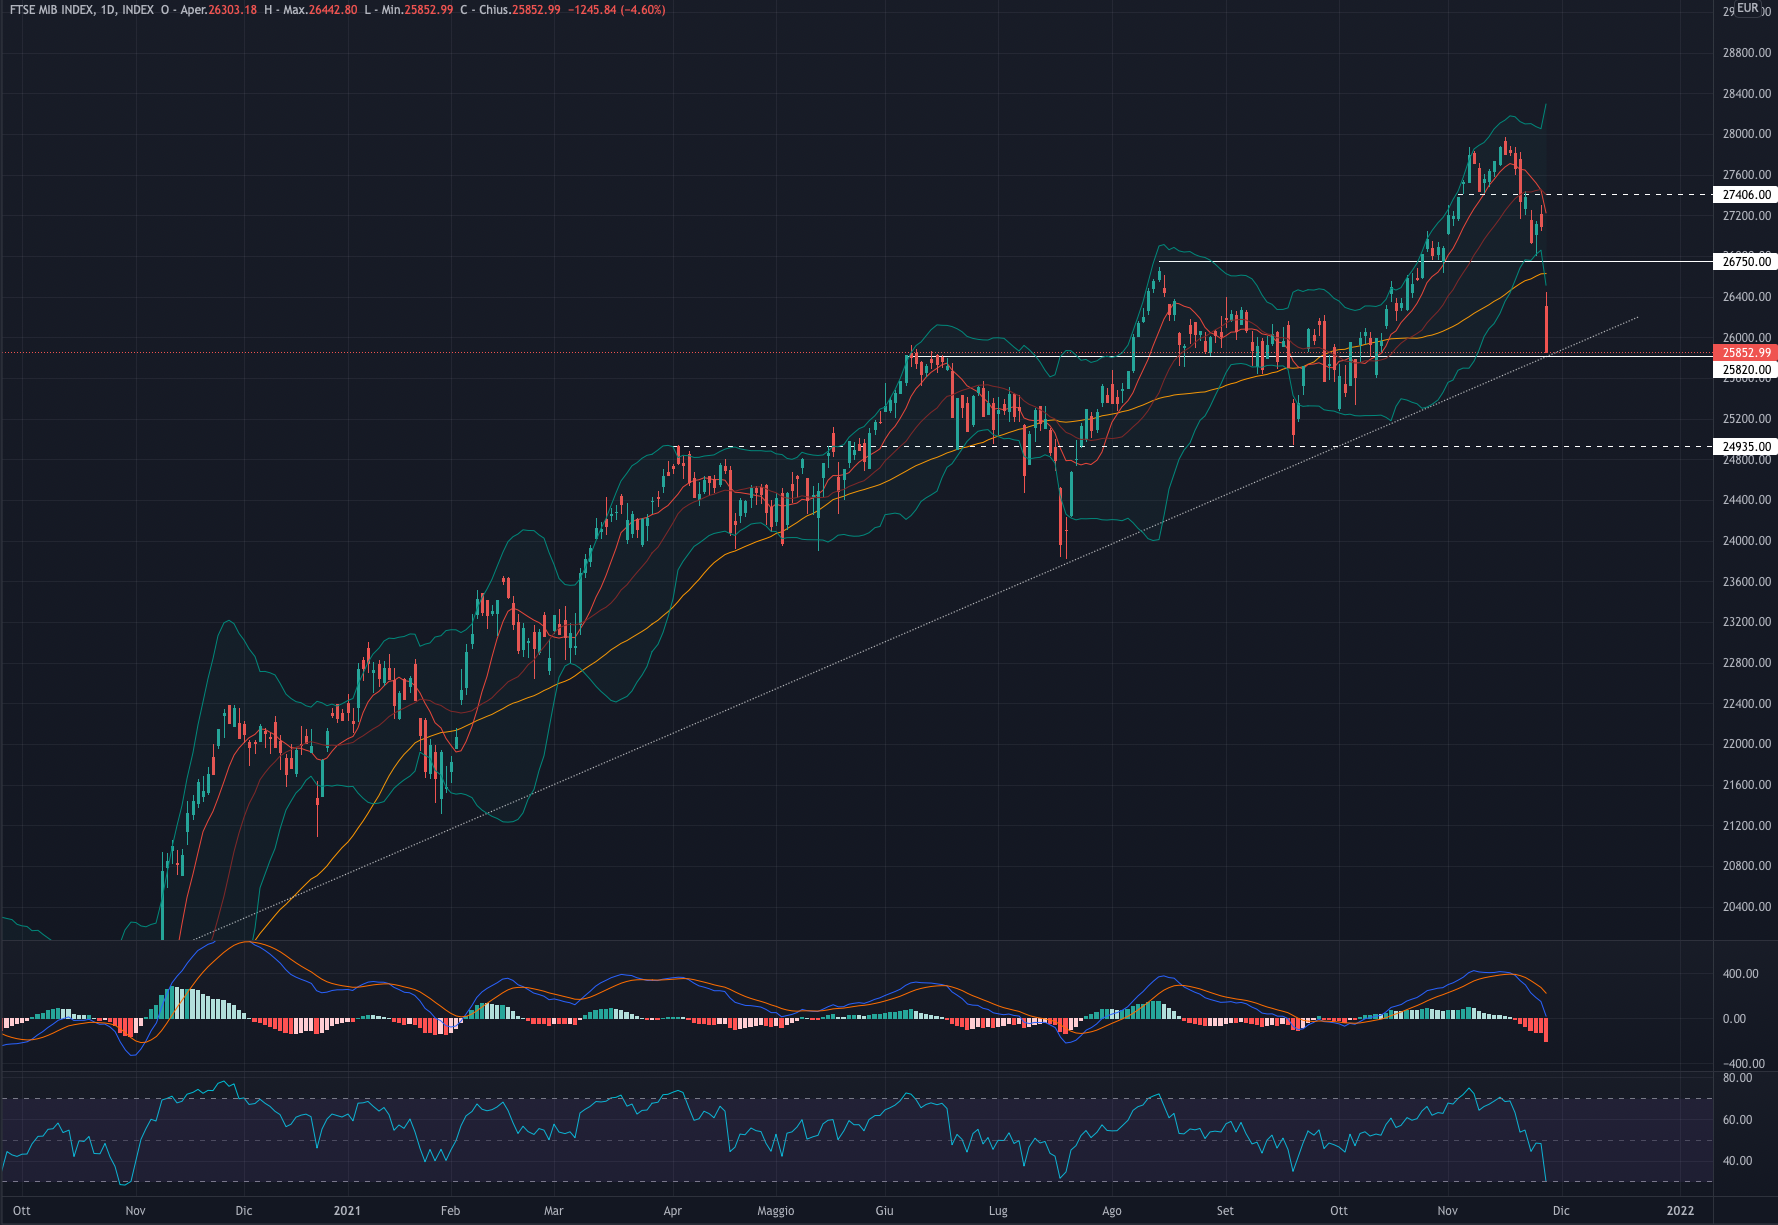
FTSEMIB (#FTSEMIB)
The FTSEMIB had a week down by -5.25%.
For the week we remain in favour of a consolidation between 26,000 and 25,500.
Indicators
The strong bearish swings on Friday and recent weeks have finally allowed the FTSEMIB to retrace to important support levels and exit an overbought situation.
If we look at the lows recorded each time from November 2020 to November 2021, we notice a fairly marked trendline that has been respected several times.
MACD still remains above 0 and RSI has reached the oversold zone which has led to a subsequent bullish recovery in the short to medium term in the past.
The primary trend for the moment remains bullish and we expect, after a consolidation phase, a bullish recovery at least up to the 50MA.
Support at 25,820.
Resistance at 26,750.
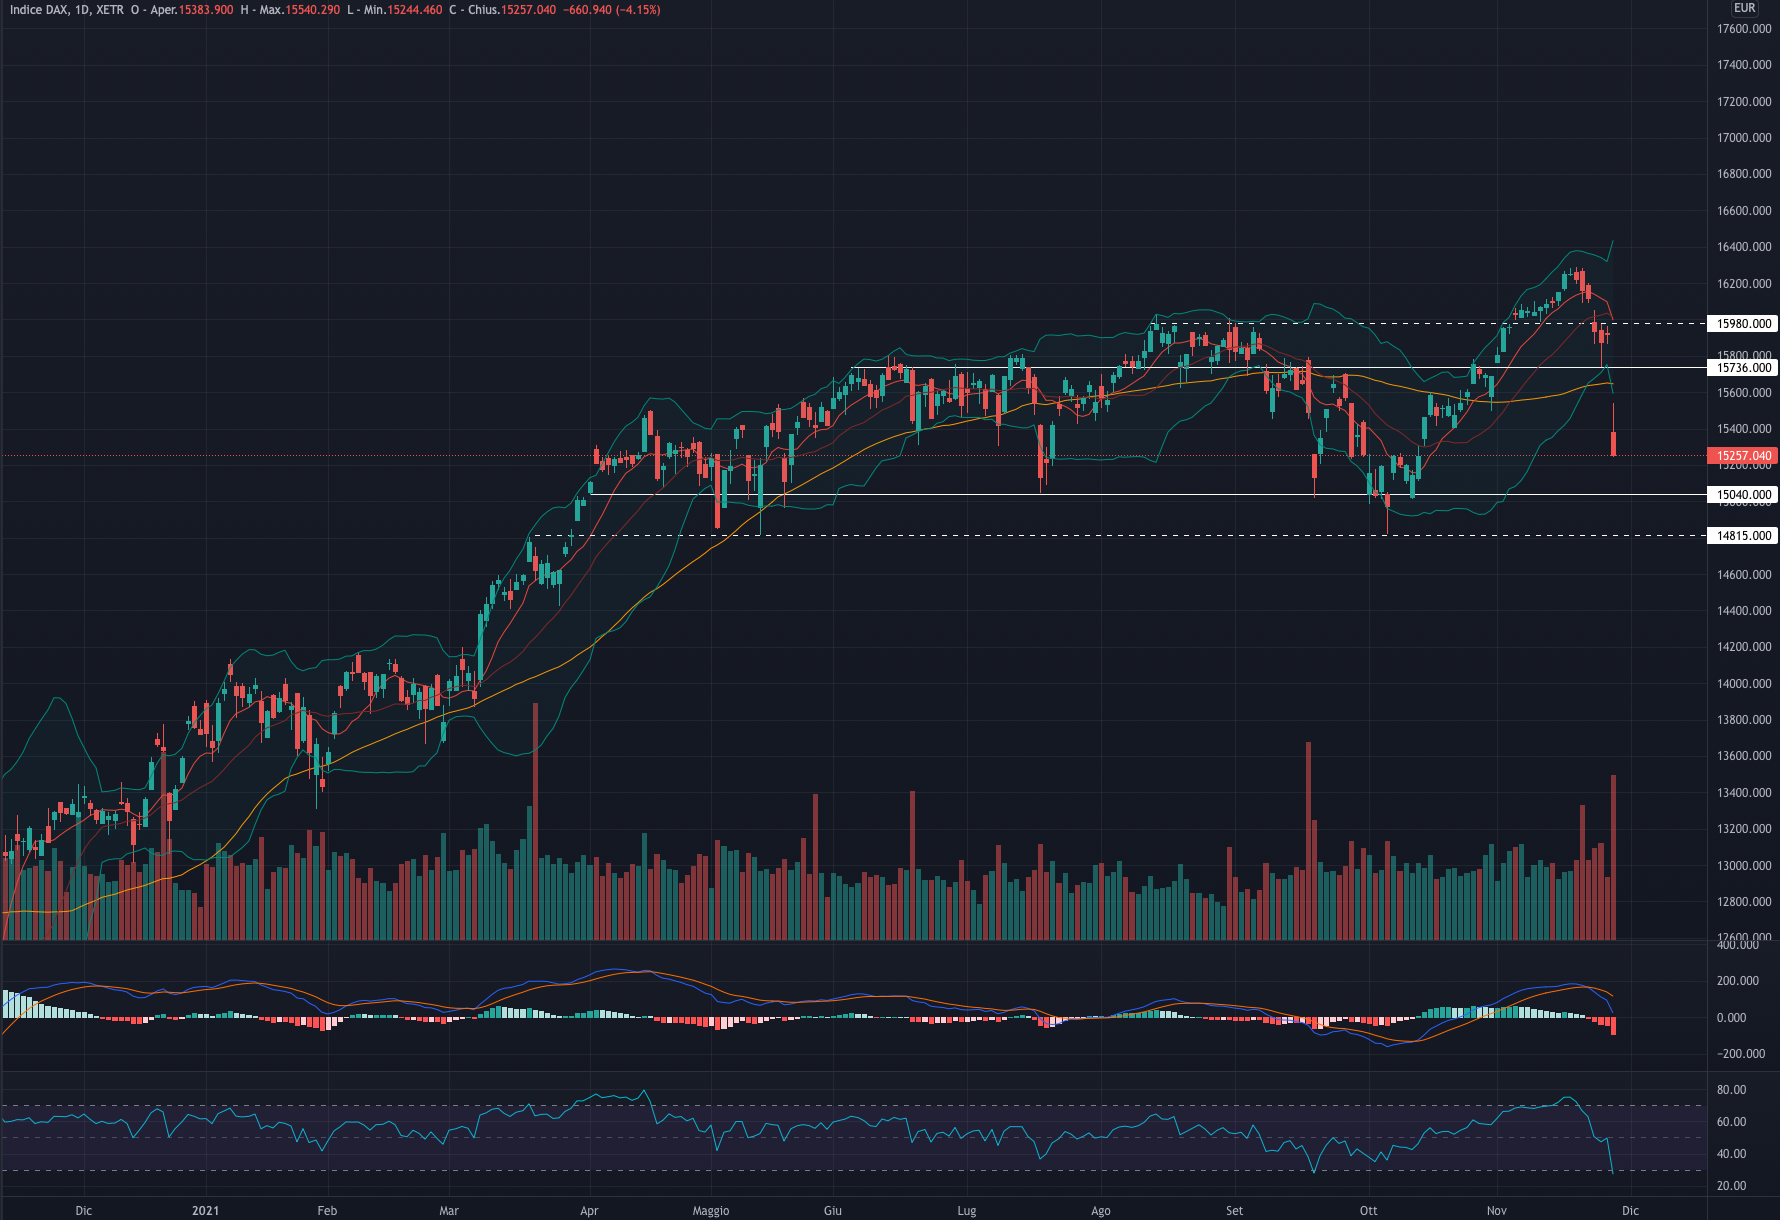
DAX (#DAX)
The DAX ended the week down -5.75%.
For the week ahead, we expect a possible consolidation between 15,400 and 15,100.
Indicators
The German index after a series of bearish days is now approaching what we believe to be an interesting area of support that would lead to a reversal to the upside.
Looking at previous moves, the horizontal channel 15.040 - 15.736 has been largely respected in the last 8 months, except for short periods above it.
MACD is continuing the bearish reversal still remaining above 0 and the RSI has reached the oversold zone: it is important to note that the oversold zone has only been reached by the DAX 3 times since October 2020.
The primary trend remains intact and we believe that, after a consolidation phase, we will see a bullish recovery aiming at the current resistance.
Support for 15.040.
Resistance at 15,736.
S&P500 (#SPX)
The S&P 500 had a week down by -2.21%.
For the coming week, the index could continue downside and consolidate between 4,550 - 4,600.
Indicators
What once appeared to be an ascending triangle broke to the downside, the SPX tested the intermediate support at 4,600.
In our view, the downward pressure could continue at least till 4,550, an area close to the 50MA. This level could serve as a good reversal area for a bullish recovery.
MACD, still well above 0, continues the bearish momentum.
RSI is now at 43: a level tested several times in the past.
The primary trend continues to be bullish and the price is finally approaching interesting support areas.
Support for 4,600.
Resistance at 4,720.
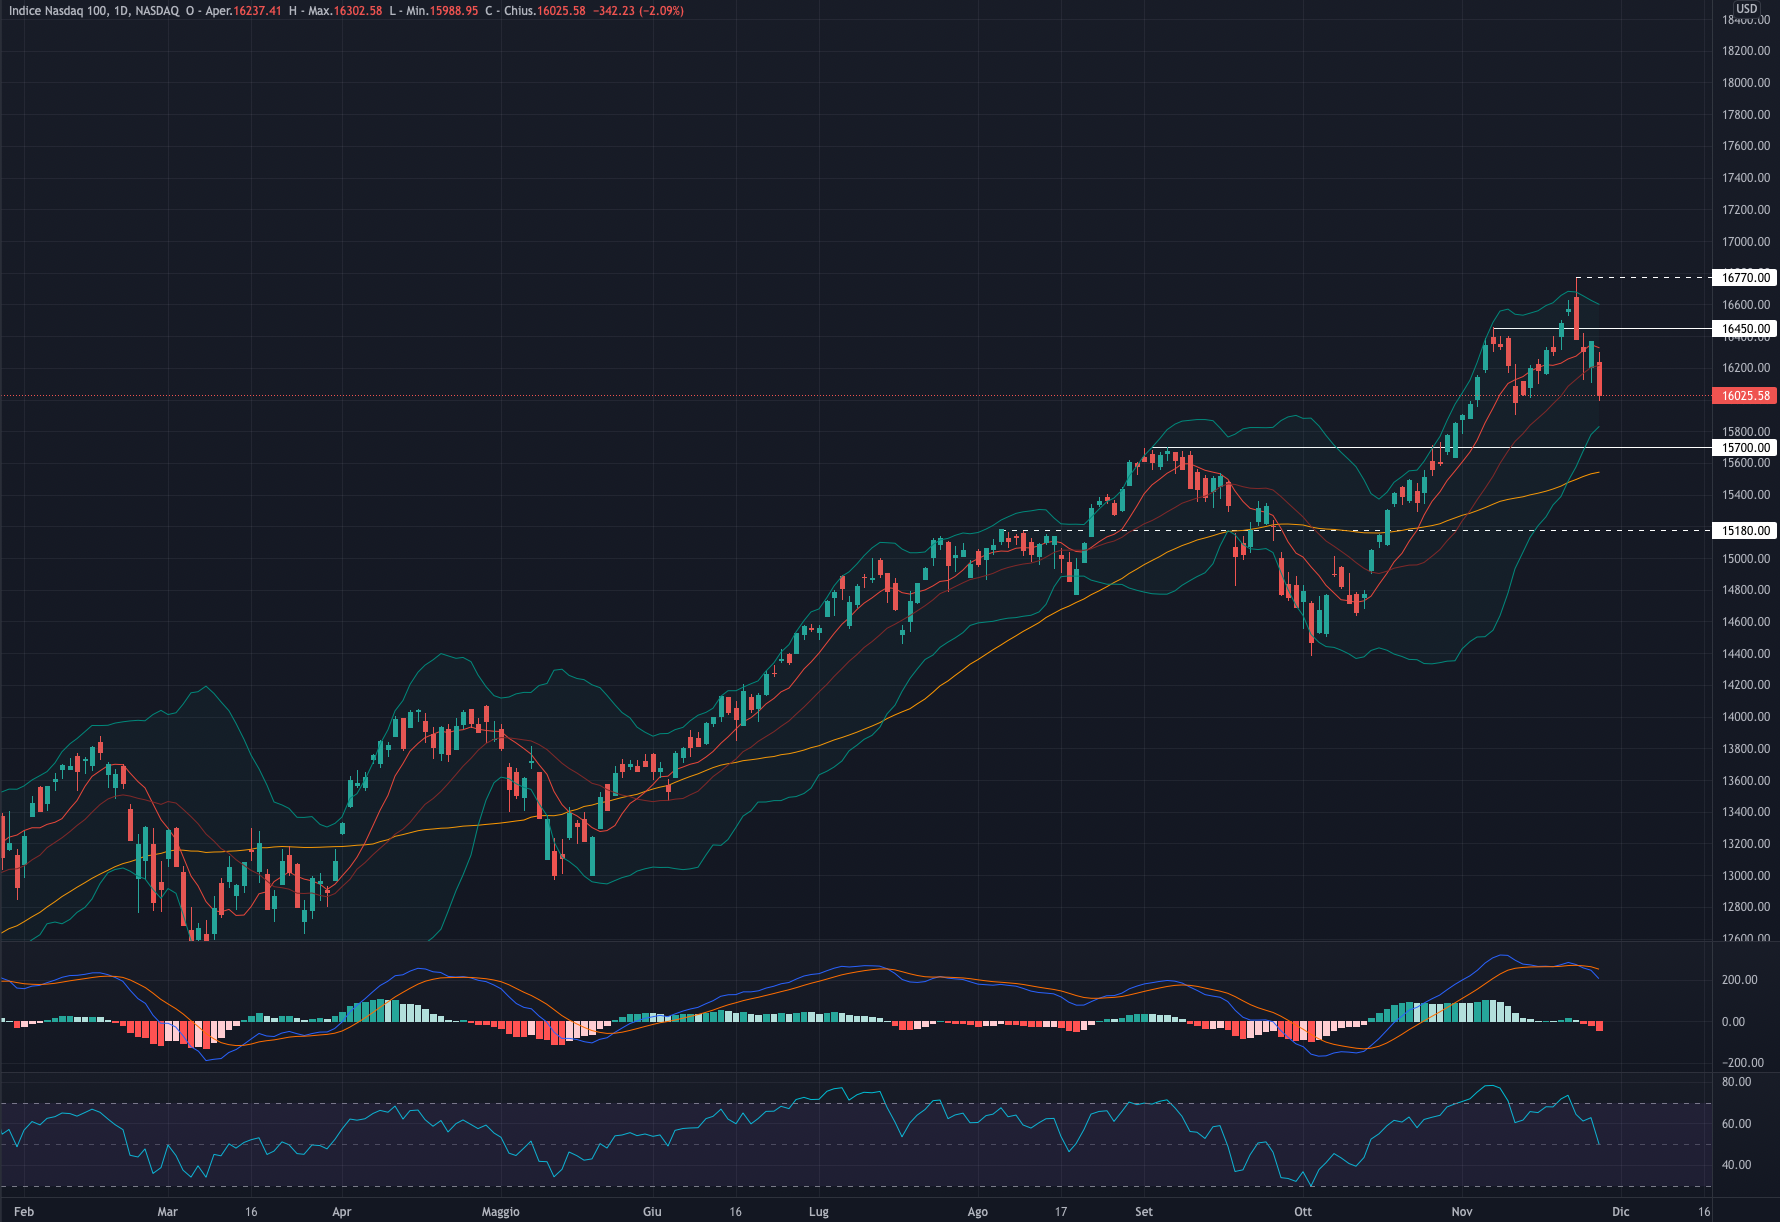
Nasdaq 100 (#NDX)
The NASDAQ ended the week down -3.03%.
For the week ahead, we expect a possible bearish continuation to 15,800.
Indicators
The technology index is now at intermediate support which led it to a good upside reversal on 10 November.
We would be in favour of a reversal if MACD and RSI would not be on a decreasing phase: MACD has reversed downwards and RSI, at 50, does not signal trend reversals but rather a negative divergence between the low of 10 November and the current price.
Before long positions, we prefer to see a further retracement in the area of the 50MA.
Support at 15,700.
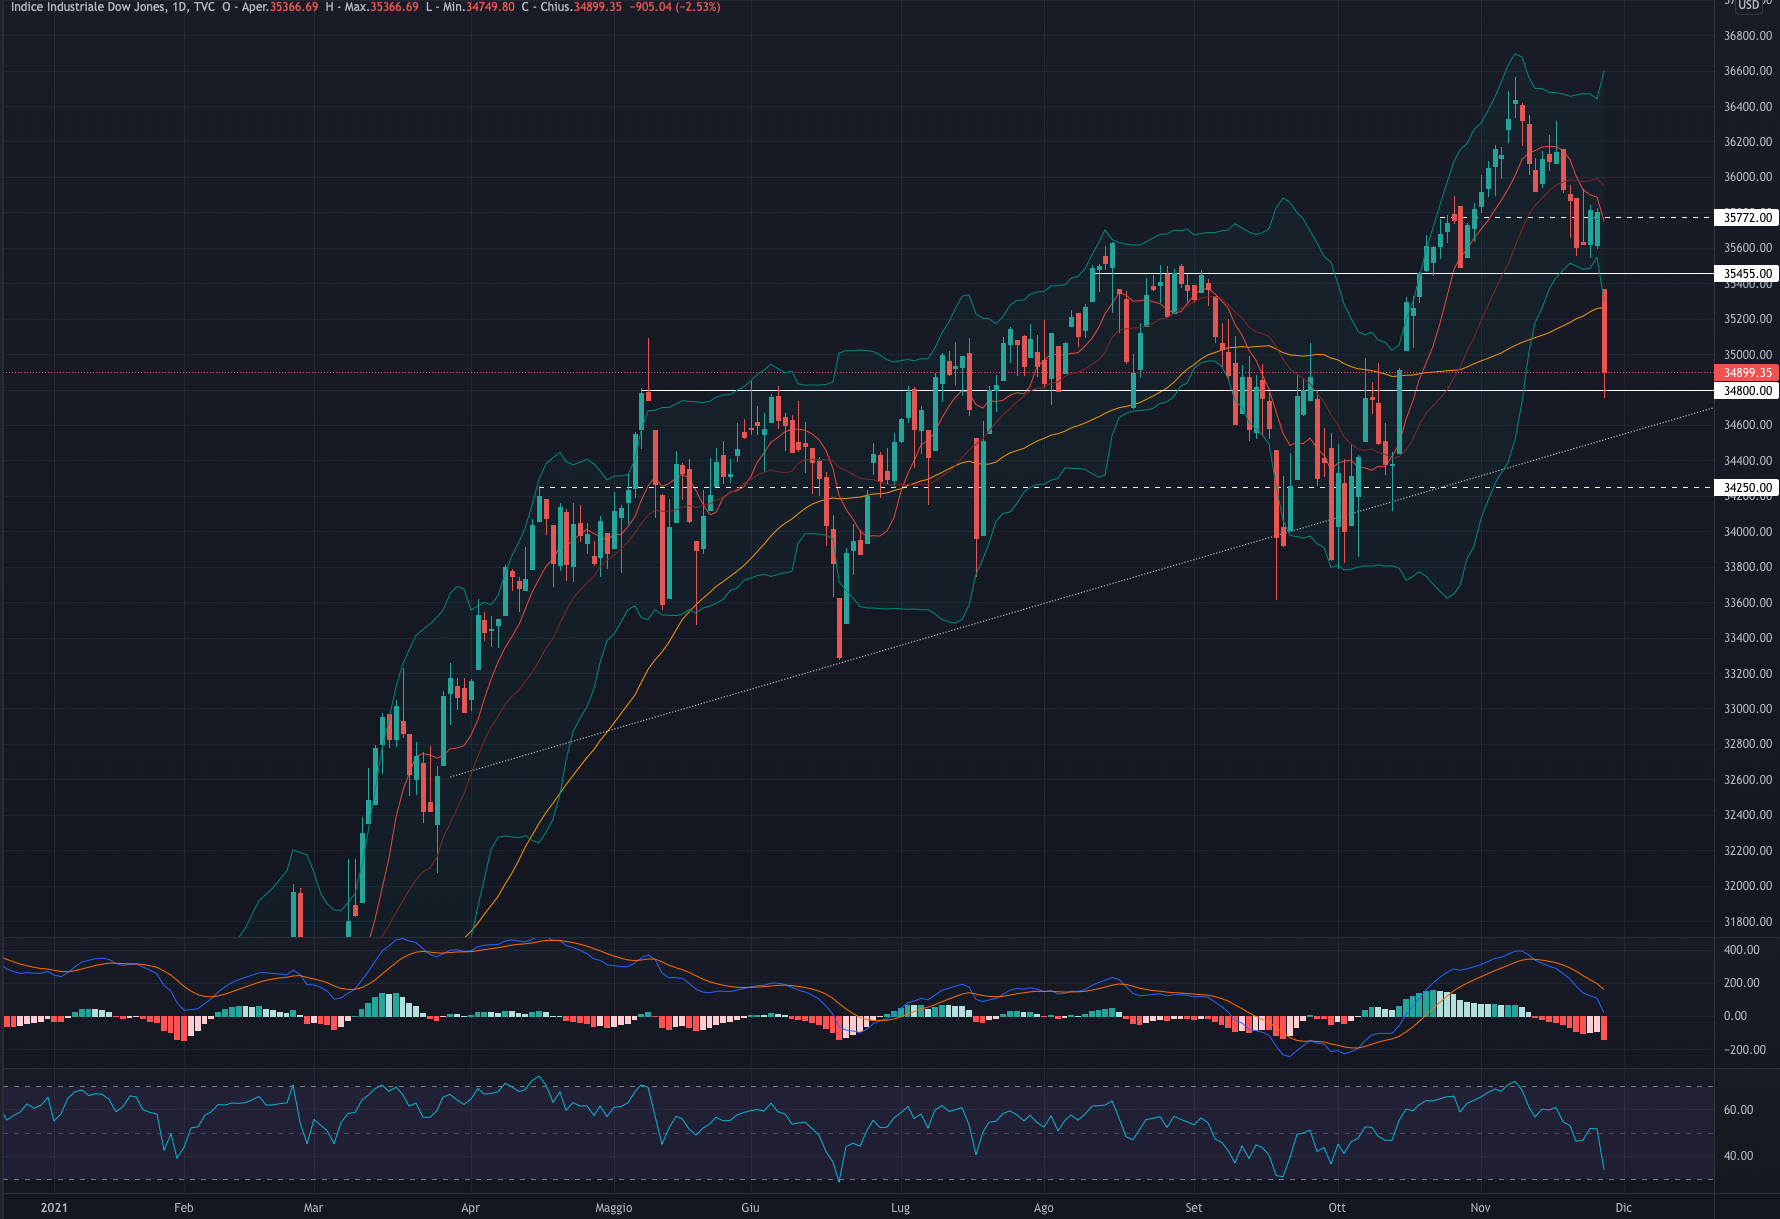
Dow Jones (#DJI)
DOW JONES had a week down -2.16%.
For the week ahead, we expect a consolidation at 34,900 - 34,600.
Indicators
In what could be called a head-and-shoulders formation, the DJI broke down on Friday.
We believe the bullish trendline in existence since March 2021 can represent an excellent reversal point: for this reason, we assume a consolidation between 34.900 and 34.600 and then continue upwards.
MACD continues to be bearish and the RSI has reached the oversold zone: looking at previous swings, the index has then gradually begun to reverse to the upside.
The sell-off during the past weeks, which intensified on Friday, allows in our view for better long positions.
Support to 34,800.
Resistance 35,455.
Author

Francesco Bergamini
OTB Global Investments
Francesco, BSc Finance and Msc in Business Management, graduated with Merit, is a professional with experience in the financial services industry and a keen interest in the financial markets.


