The monetary policy dichotomy in emerging economies

The acceleration in inflation has become the main concern of central banks. In emerging countries, this led to hikes in policy rates in Brazil, Russia and Turkey in 20201. Since mid-2021 other central banks in Latin America (Chile, Colombia, Mexico, Peru) and Central Europe (Czech Republic, Hungary, Poland, Romania) have followed suit. The increases were particularly marked in Central Europe.
Conversely, Asian central banks, other than in South Korea, have kept their powder dry2. The main reasons for this lie in the level and dynamics of inflation. It is high and accelerating in Latin America and Europe, moderate and more gradual in Asia, particularly in China and the most industrialized economies (South Korea, Taiwan, Singapore). How can we explain this dichotomy, when the above-mentioned Asian countries were amongst the first to return to their pre-pandemic levels of economic activity? Is it temporary, or does it result from lasting underlying factors whereby Asian central banks can hold off tightening monetary policy, or at least limit its magnitude ?
Underlying inflation: Differences and divergence since 2018
To answer this question, this note sets out a comparative analysis of inflation and its main drivers between two groups of countries having relatively similar economic structures, with a strong industrial base: Central European countries (Hungary, Poland, Czech Republic; CECs hereafter) and industrialized Asian countries excluding Japan (South Korea, Taiwan, Singapore; NIAs hereafter). The comparison covers a five-year period. It has been made easier by the fact that over this period the exchange rates of these countries have not moved significantly, in either direction, relative to their benchmark currency (the US dollar for the NIAs and the euro for CECs).
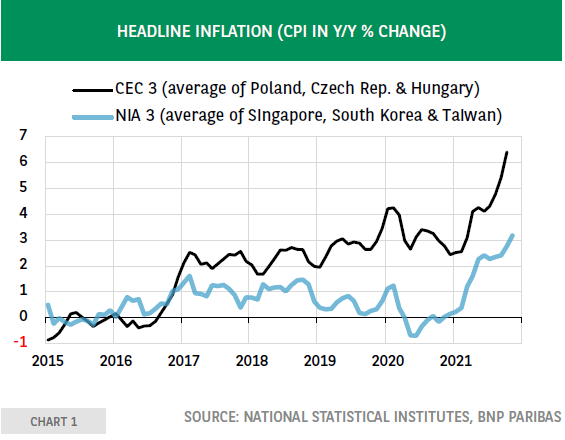
Three measures of inflation are used: headline inflation, official core inflation and inflation excluding food, energy and housing costs3.
From 2017, headline inflation rates showed divergent trends up to the end of 2019: deceleration in the NIAs, acceleration in the CECs (Chart 1). Then, the curves went more hand in hand in 2020 (deflation in the NIAs, deceleration in the CECs), followed by an acceleration in 2021.
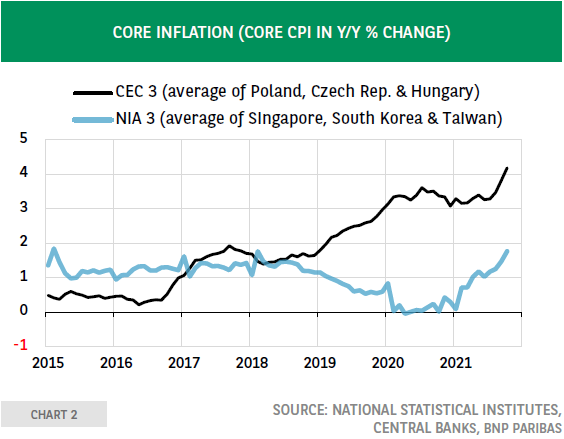
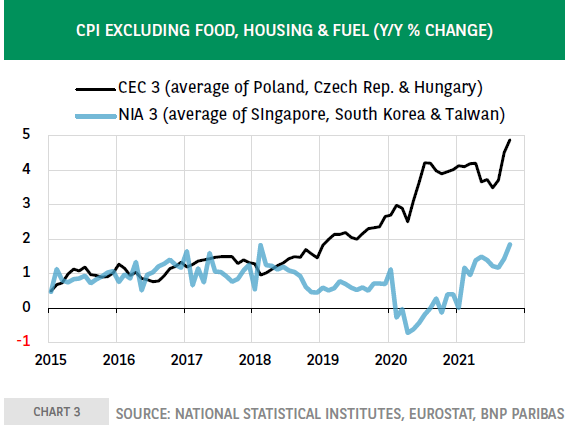
Core inflation rates followed significantly different paths: for the NIAs, stability to the end of 2018, deceleration in 2019 and 2020, and then a re-acceleration in 2021 that was, however, much less marked than headline inflation (Chart 2). Conversely, in the CECs, core inflation rose throughout the period, a trend interrupted temporarily by the recession in 2020. Lastly, inflation rates excluding food, energy and housing costs show and even emphasize the dichotomy between the two groups (Chart 3), even though for the NIAs, the trend was more uneven than for core inflation in the period from 2019 to 2021.
Author

François Faure
BNP Paribas
Expert in Capital flows to emerging markets, and Turkey.