The major indices open with a gap up to retest Monday’s opening high and then have a steady decline

Recap 6/28 – Tuesday, the S&P opened with a 13 handle gap up and then traded another 33 handles higher into a 9:39 AM high of the day. From that high, the S&P declined 97 handles into a 12:04 PM low. From that low, the S&P rallied 15 handles into a 12:46 AM high. From that high, the S&P declined 42 handles into a 2:43 PM low. From that low, the S&P traded in a narrow range and then declined into a slightly lower low of the day into the close.
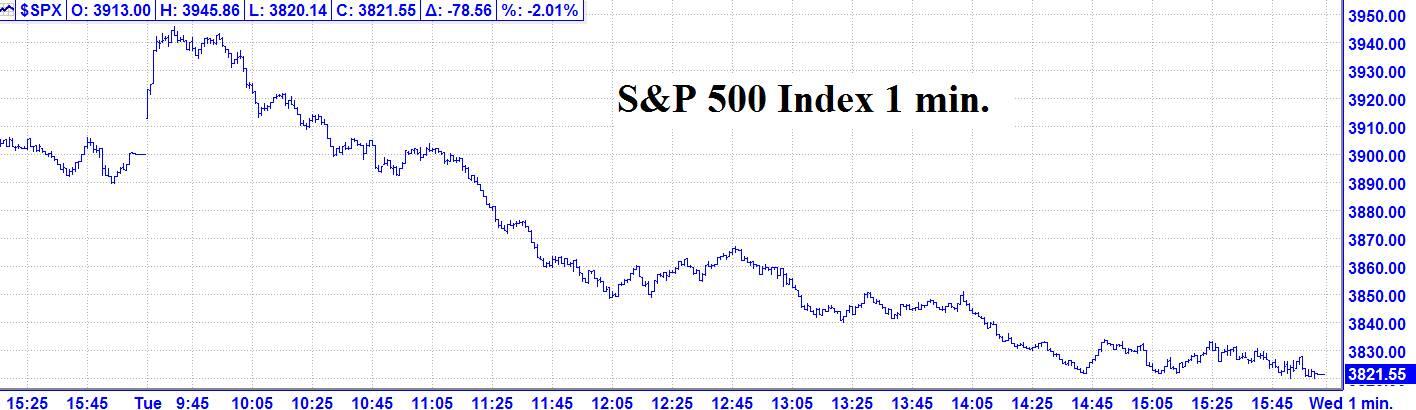
6/28 – The major indices opened with a gap up to retest Monday’s opening high and then had a strong and steady decline to finish with a huge down day per the following closes: DJIA - 491.27; S&P 500 – 78.56; and the Nasdaq Composite - 343.011.
Looking Ahead & Review - Tuesday, we got the big trend day we wanted for the S&P. This gives up a one day decline set up, which obviously is far less than the best. However that is what we have for now. We will be on alert for a possible low on Wednesday, preferably in the first hour.
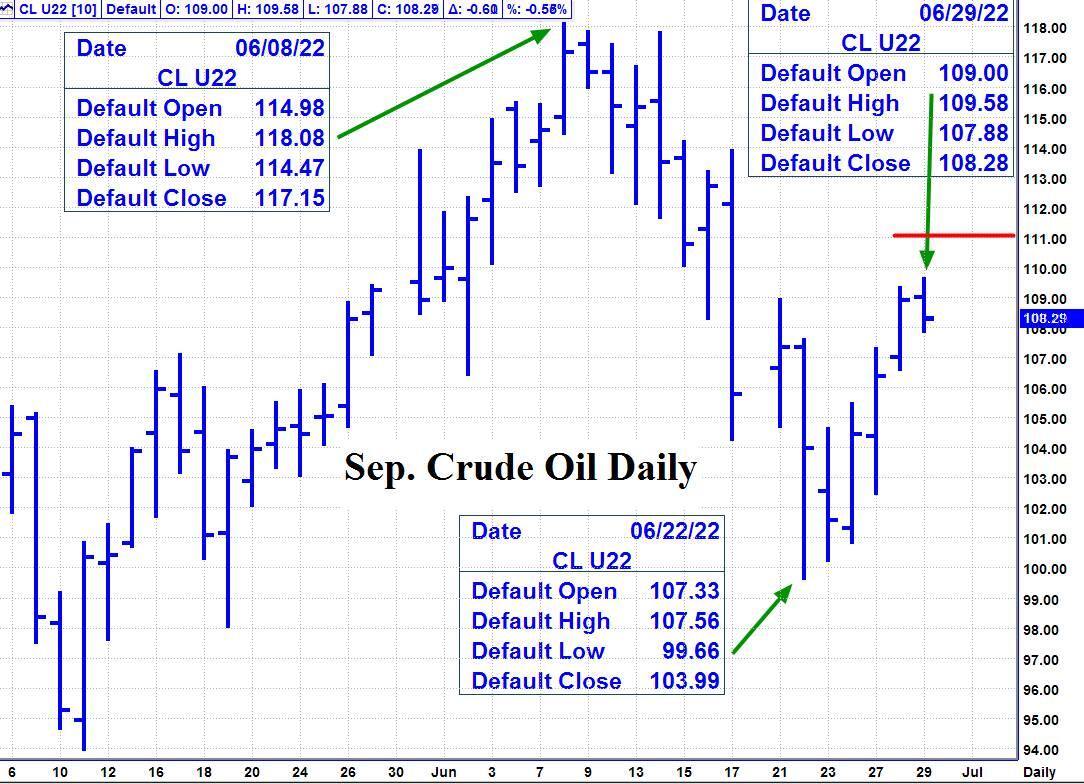
Crude Oil had another up day. The September contract is approaching the $111 level, which is the .618 retracement level, from last week’s decline. Look for a high on Wednesday. See chart below.
Be on alert for many markets to turn now with the 6/28 AC New Moon.
The Now Index is now in the NEUTRAL ZONE.
Coming events
(Stocks potentially respond to all events).
5. C. 6/27 AC – Neptune in Pisces turns Retrograde. MAJOR change in trend Commodity Index & Oil.
D. 6/28 AC – New Moon in Cancer Apogee. Major change in trend Financials, Grains, Precious Metals, Silver.
E. 7/01 AC – Jupiter 120 US North Node. Major change in trend US Stocks, T-Bonds, US Dollar.
Stock market key dates
Market math
6/29 = 861 Music days > 2/19/2020 MAJOR HIGH
Astro – 6/28, 6/29, 7/1 AC.
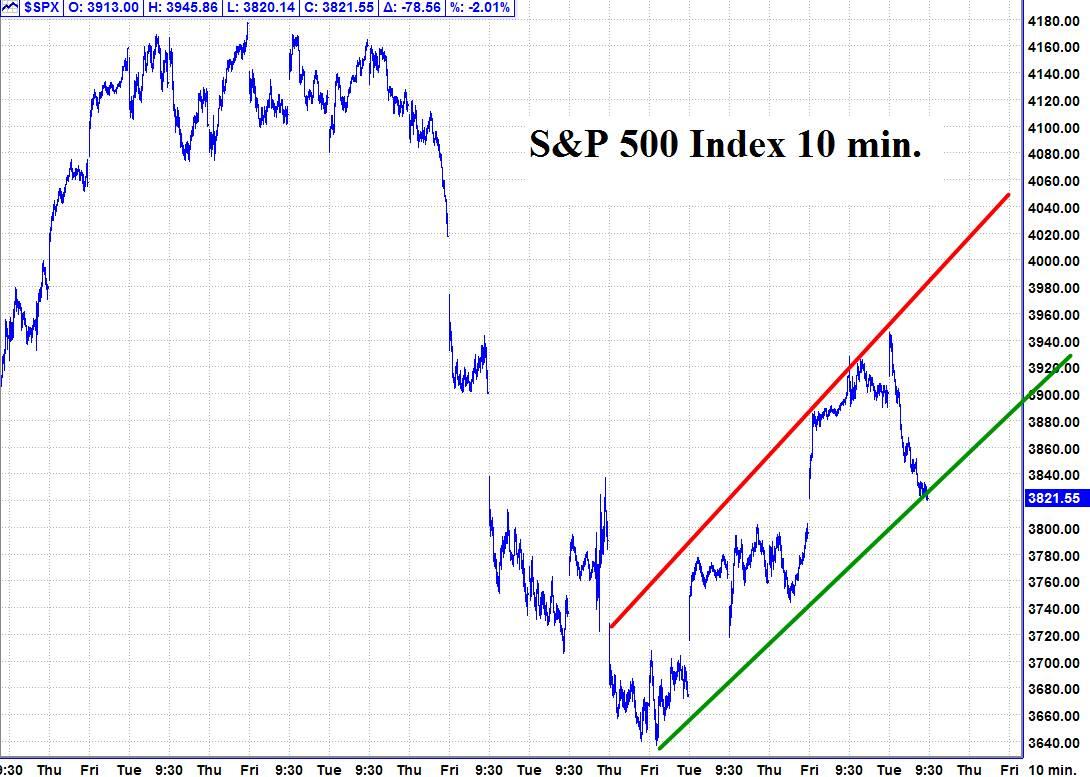
Please see below the S&P 500 10 minute chart.
Support - 3820 Resistance – 3945.
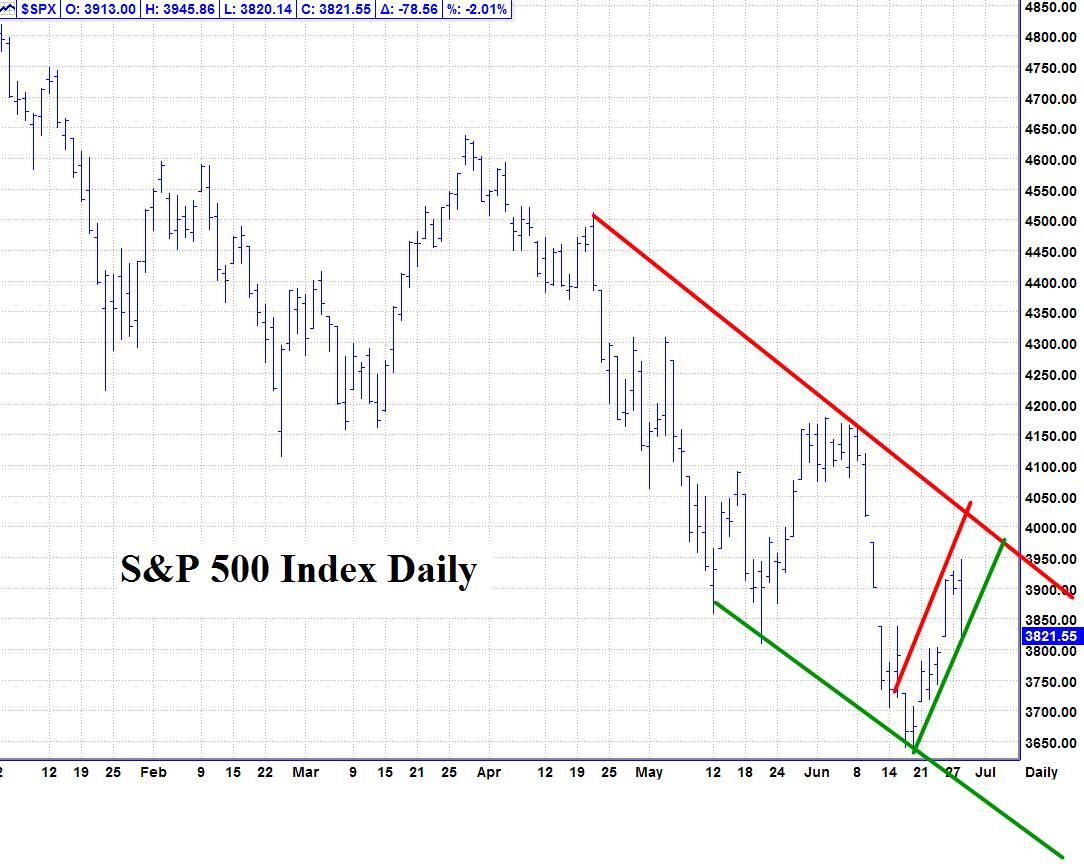
Please see below the S&P 500 Daily chart
Support - 3820 Resistance – 3945.
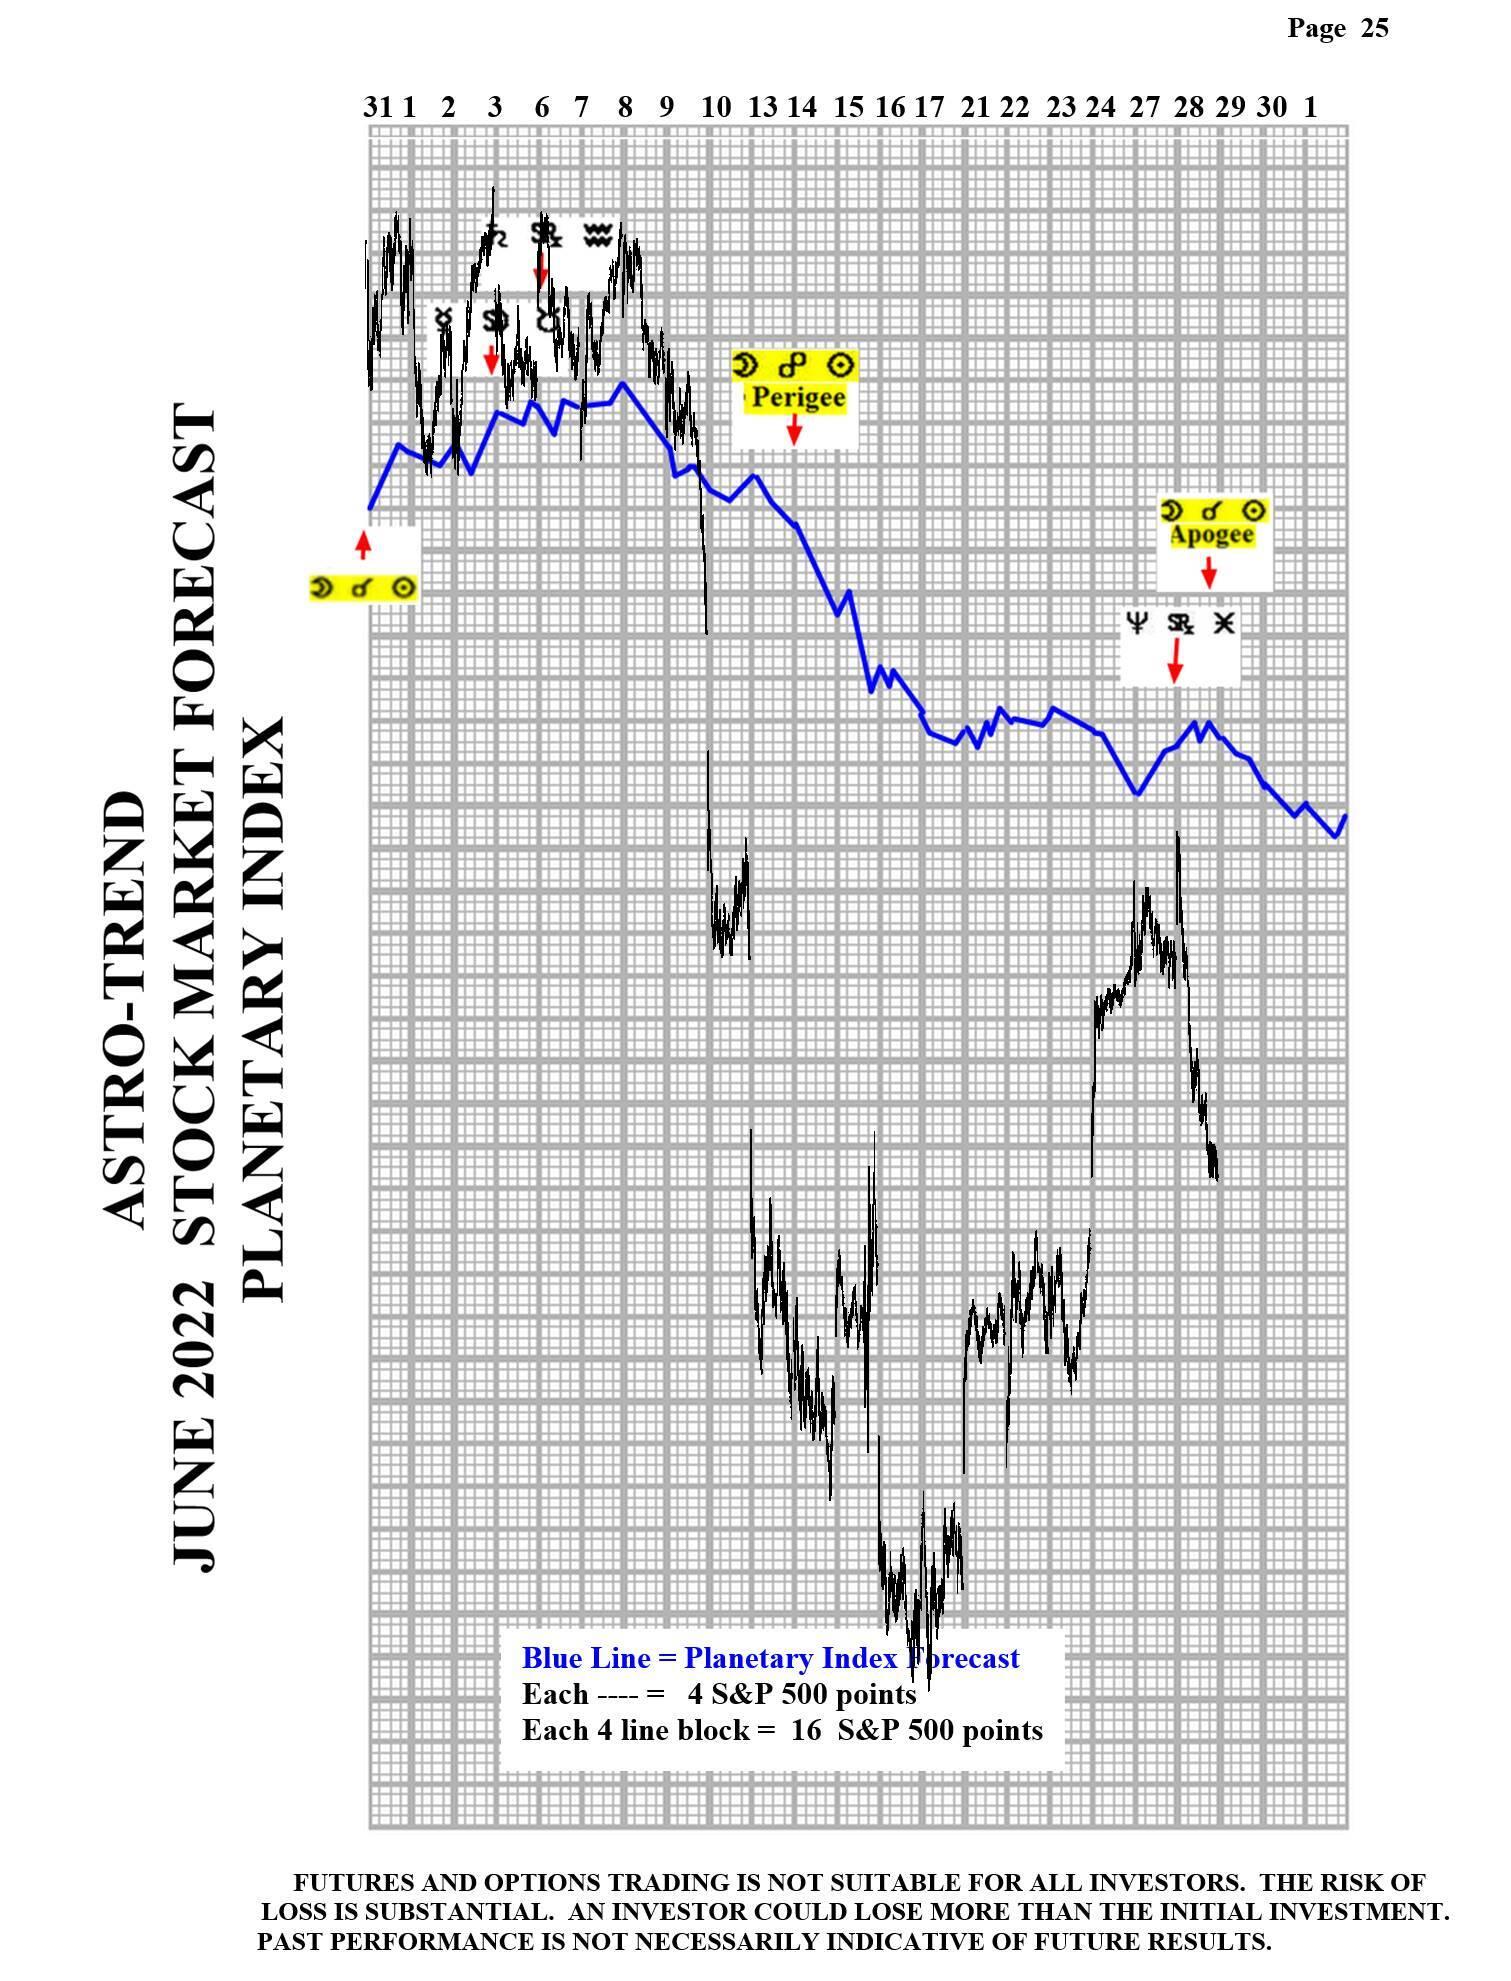
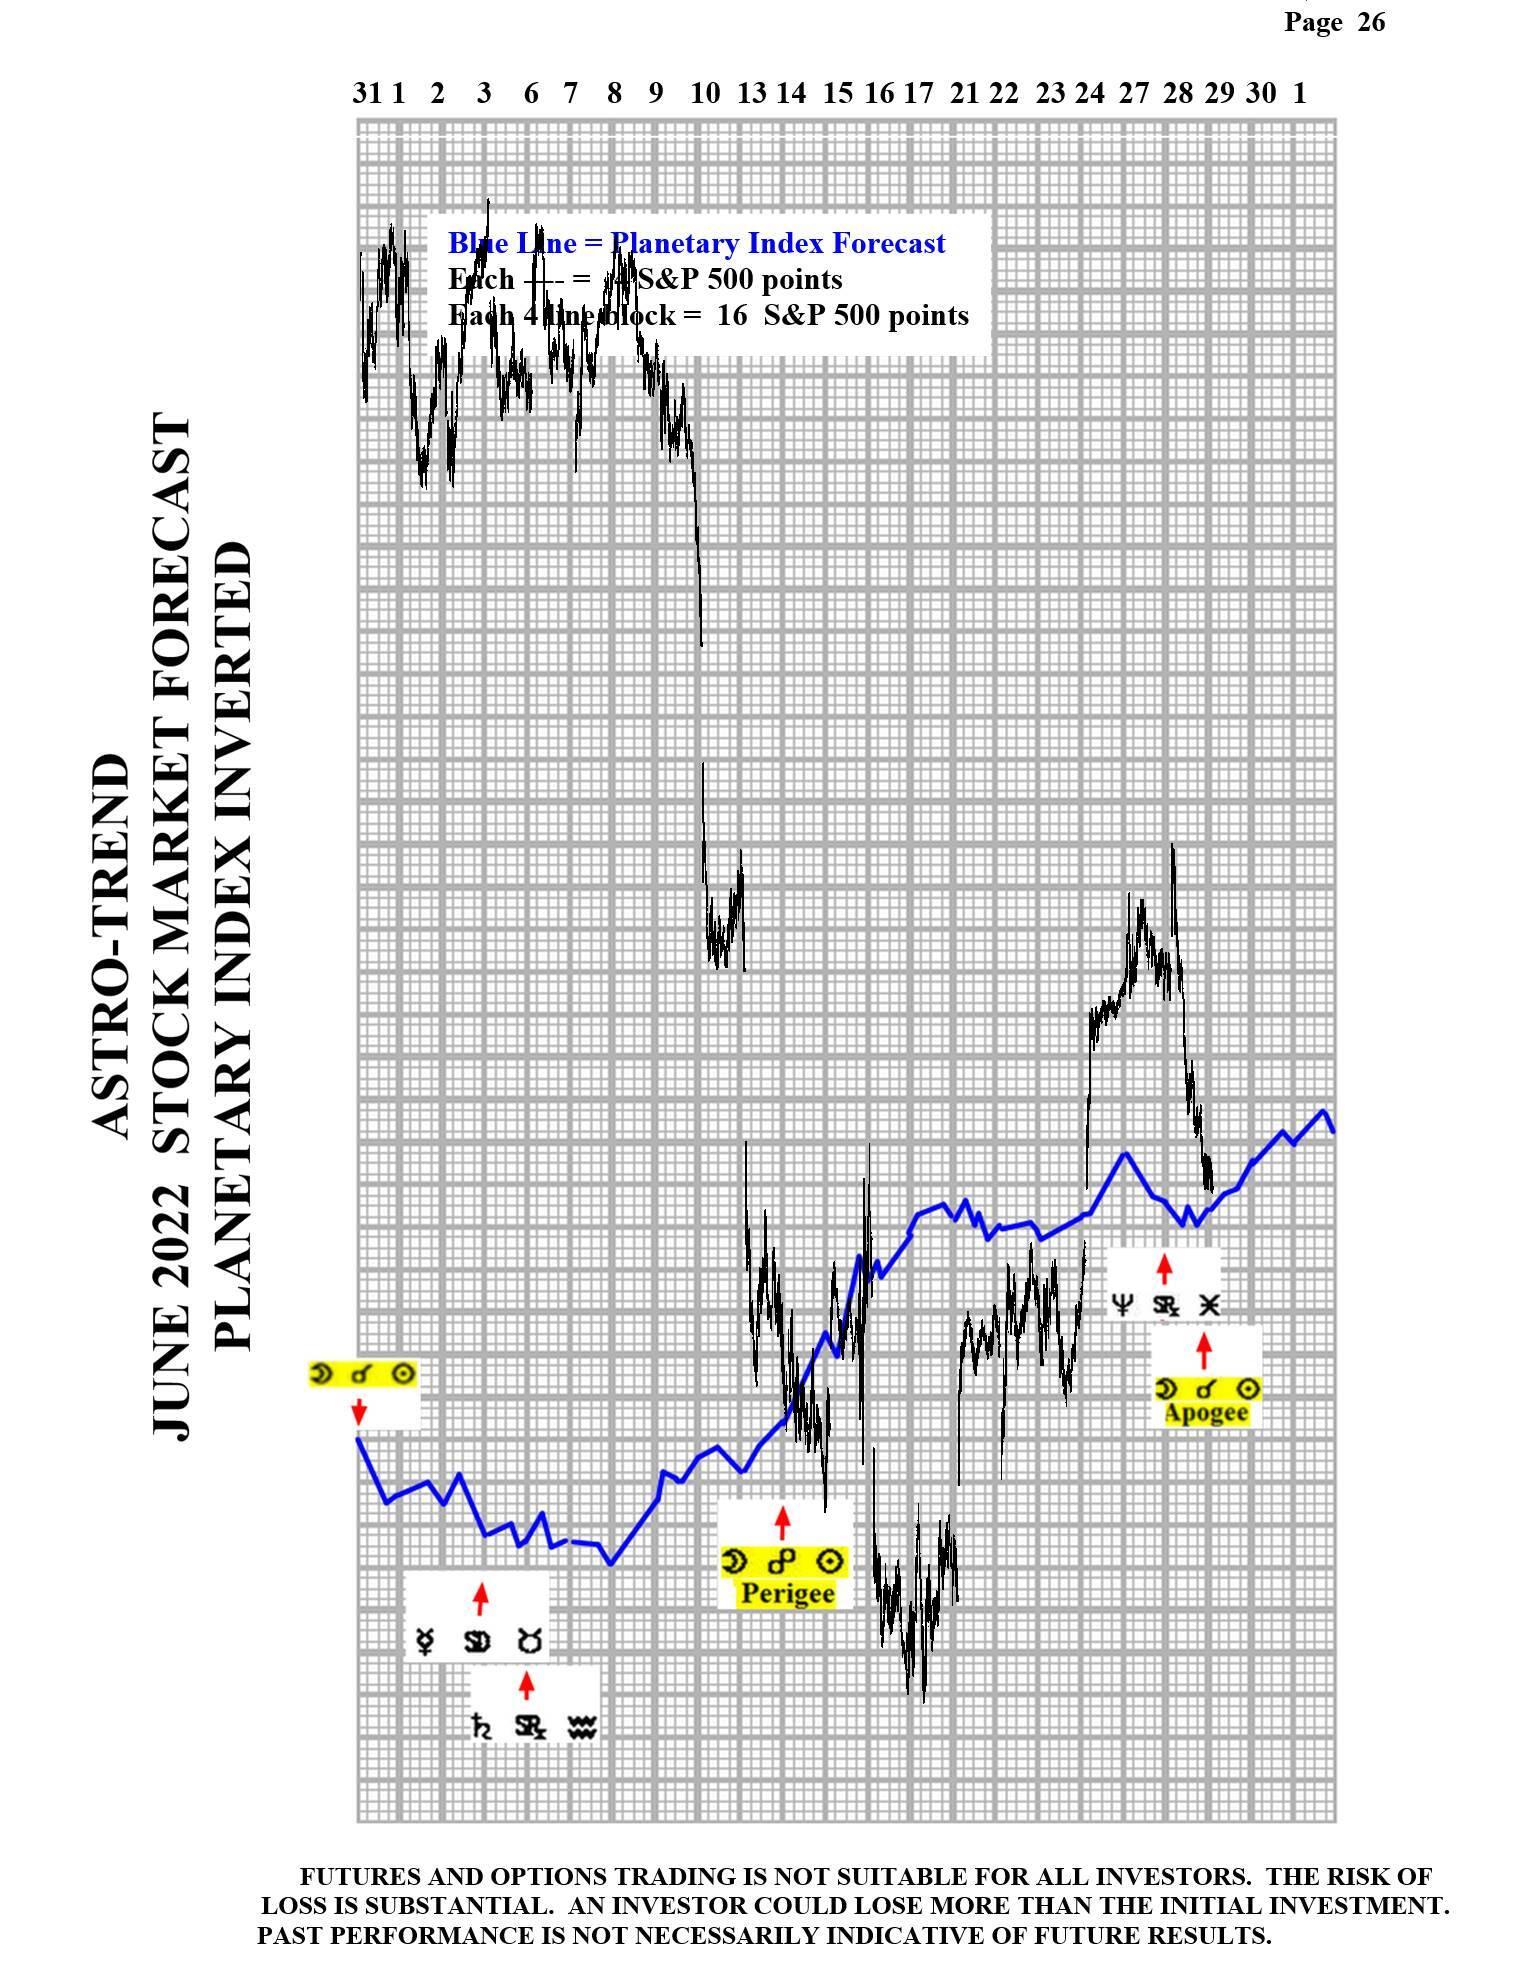
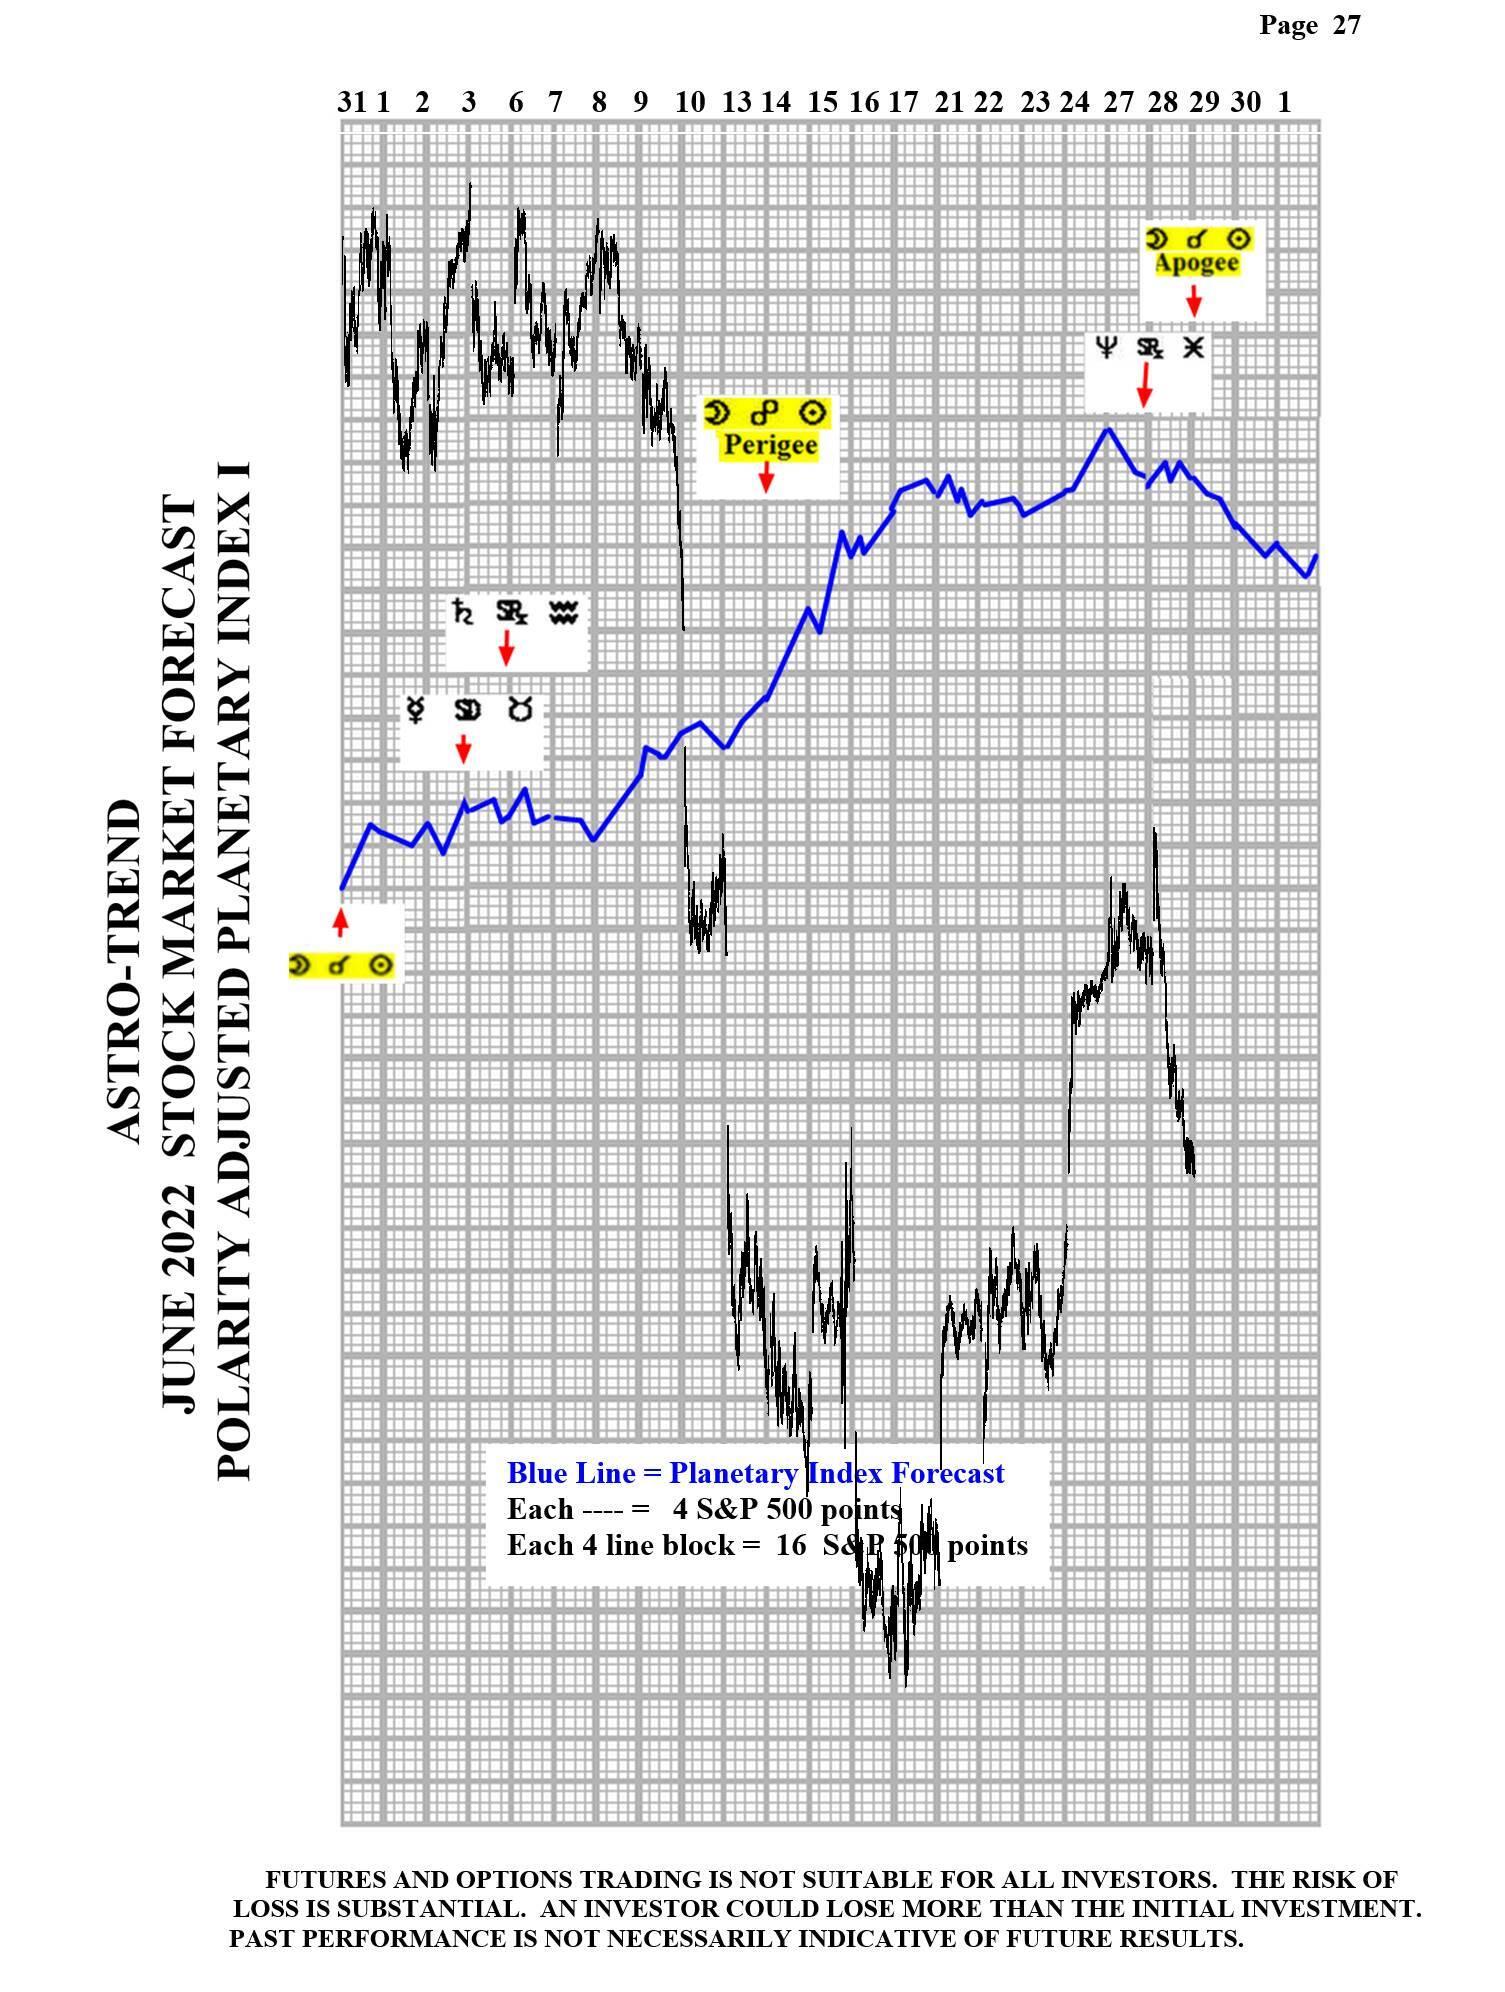
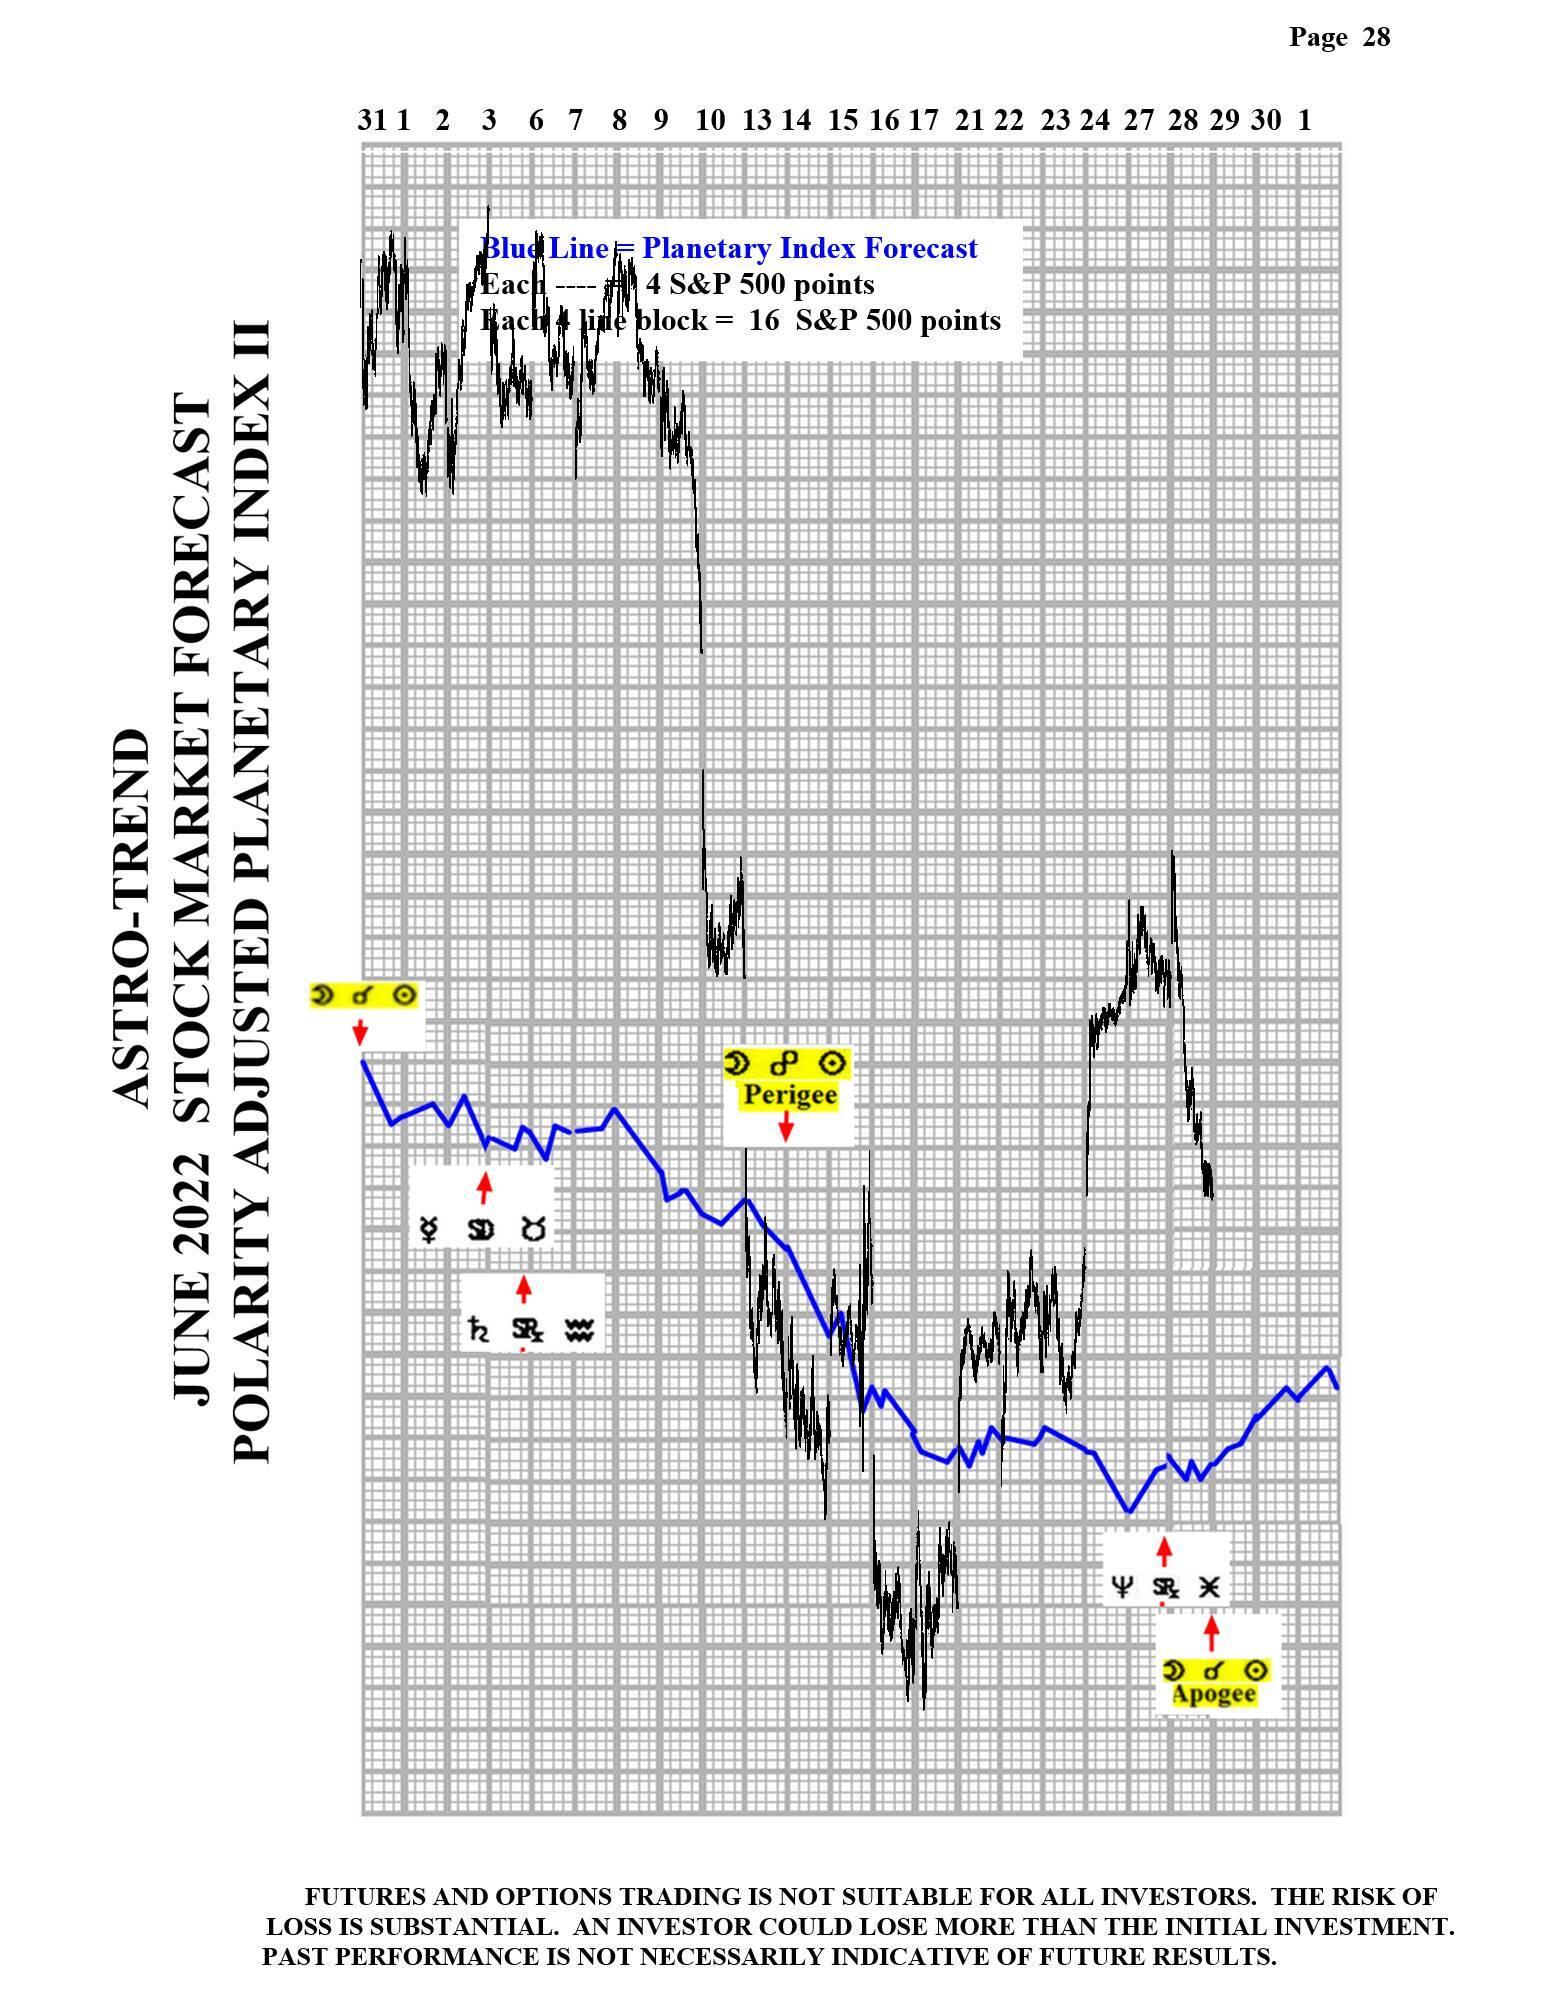
Please see below the June Planetary Index chart with S&P 500 10 minute bars for results.
Author

Norm Winski
Independent Analyst
www.astro-trend.com


