The major indices have a huge up day – What's next for Nasdaq?

Recap 08/10 - The S&P opened with a 58 handle gap up and then rallied another 17 handles into a 9:50 AM high. From that high, the S&P declined 21 handles into a 10;21 AM low. From that low, the S&P rallied 33 handles into a 11:06 AM high. From that high, the S&P traded into a 15 handle mostly sideways range, culminating with a low at 3:00 PM. From that low, the S&P rallied 17 handles into a 3:47 PM high of the day and the close.
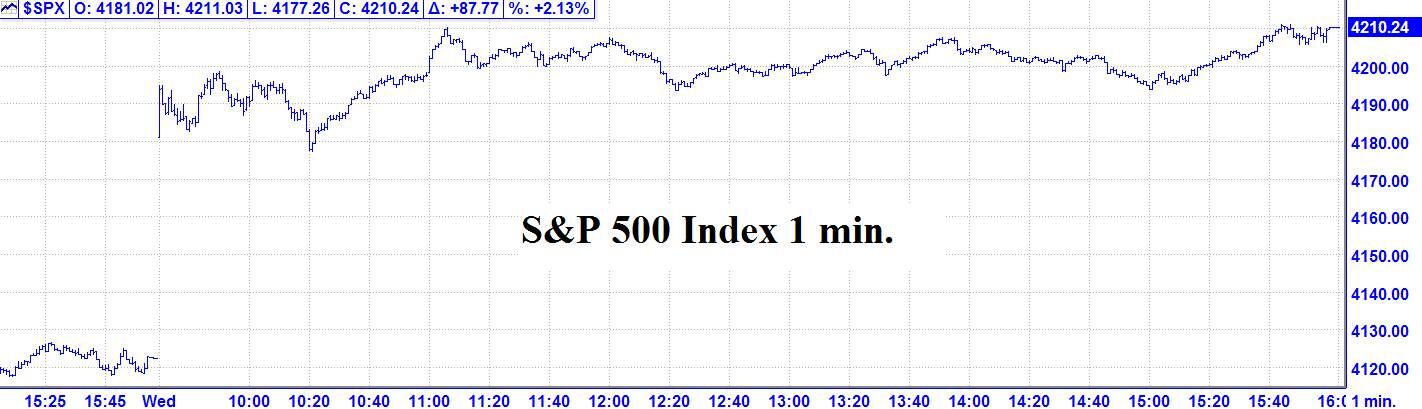
8/10 – The major indices had a huge up day and finished per the following closes: DJIA + 535.10; S&P 500 + 87.77; & the Nasdaq Comp. + 360.88.
Looking Ahead – The next major change in trend is due 8/10 AC and we have another MAJOR one 8/11 AC, Please see details below. Now, it’s getting very interesting. Due to Wednesday’s big rally, the S&P is now flirting with the 4228 level, which is a 50% retracement of the entire 2022 bear market. The 8/11 AC change in trend is potentially the most powerful of the three day window with a Full Moon and Mercury 0f South Latitude. For everything to perfectly converge, and that seldom happens, we would like to see the S&P around 4288 at the 8/11 close or 8/12 open, and for that area to hold. However, it seems that with Wednesday’s big rally, the price may have gotten somewhat ahead of the time, making that scenario less likely. Anyway, stay tuned, it should be very interesting.
The Now Index is in the NEUTRAL ZONE.
Coming events
(Stocks potentially respond to all events).
2. A. 8/10 AC – Pluto Parallel US Part of Fortune. Major change in trend US Stocks, T-Bonds, US Dollar.
B. 8/11 AC – Full Moon in Aquarius. Major change in trend Financials, Grains, Precious Metals, Copper.
C. 8/11 AC – Mercury 0 South Latitude. Major change in trend Corn, Oats, Soybeans, Wheat.
D. 8/12 AC – Moon’s North Node Parallel Uranus. Major change in trend CATTLE, COTTON, Copper, Silver.
E. 8/18 AC – Helio Jupiter enters Aries. Major change in trend Coffee, Corn, Gold, Oats, OJ, Silver, Sugar, Wheat.
F. 8/18 AC – Moon’s North Node 45 US Venus. Moderate change in trend US Stocks, T-Bonds, US Dollar.
G. 8/19 AC – Geo Mars enters Gemini. Important change in trend Stocks.
Stock market key dates
Market Math
8/10 = 12,769 (113^2) days > 8/25/1987 MAJOR HIGH.
8/17 = 20,643 music days > 2/09/1966 MAJOR HIGH.
8/23 = 17,424 (132^2) days > 12/09/1974 MAJOR LOW.
8/28 = 8,192 music days > 3/24/2000 MAJOR HIGH.
Fibonacci – 8/17, 8/22,
Astro – 8/11, 8/12, 8/15, 8/19, 8/24, 8/26 AC.
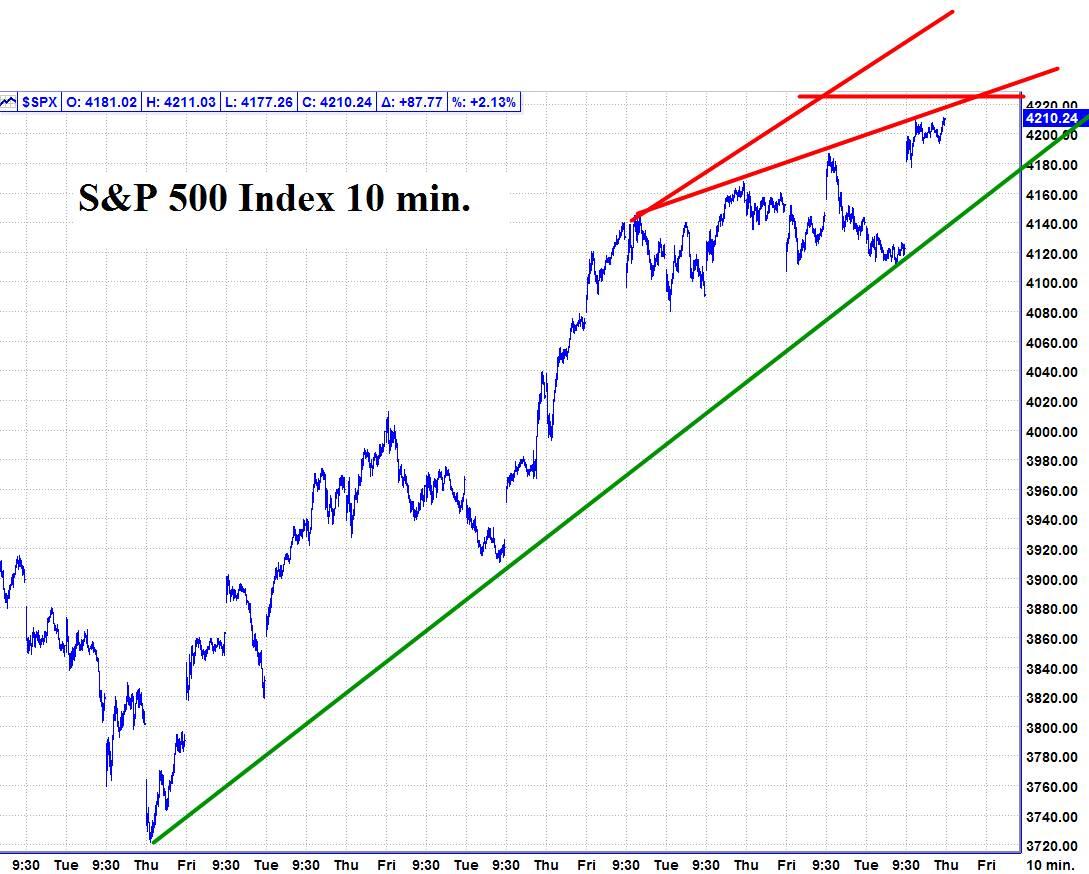
Please see below the S&P 500 10 minute chart.
Support - 4150 Resistance – 4228.
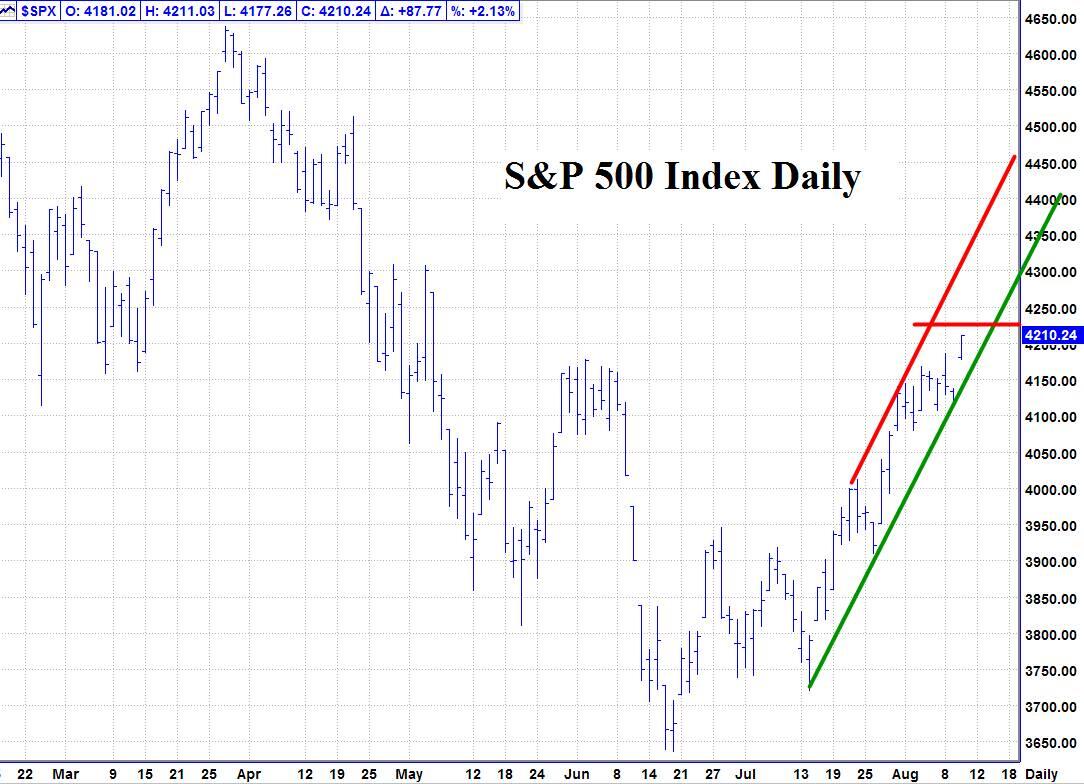
Please see below the S&P 500 Daily chart.
Support - 4150 Resistance – 4228.
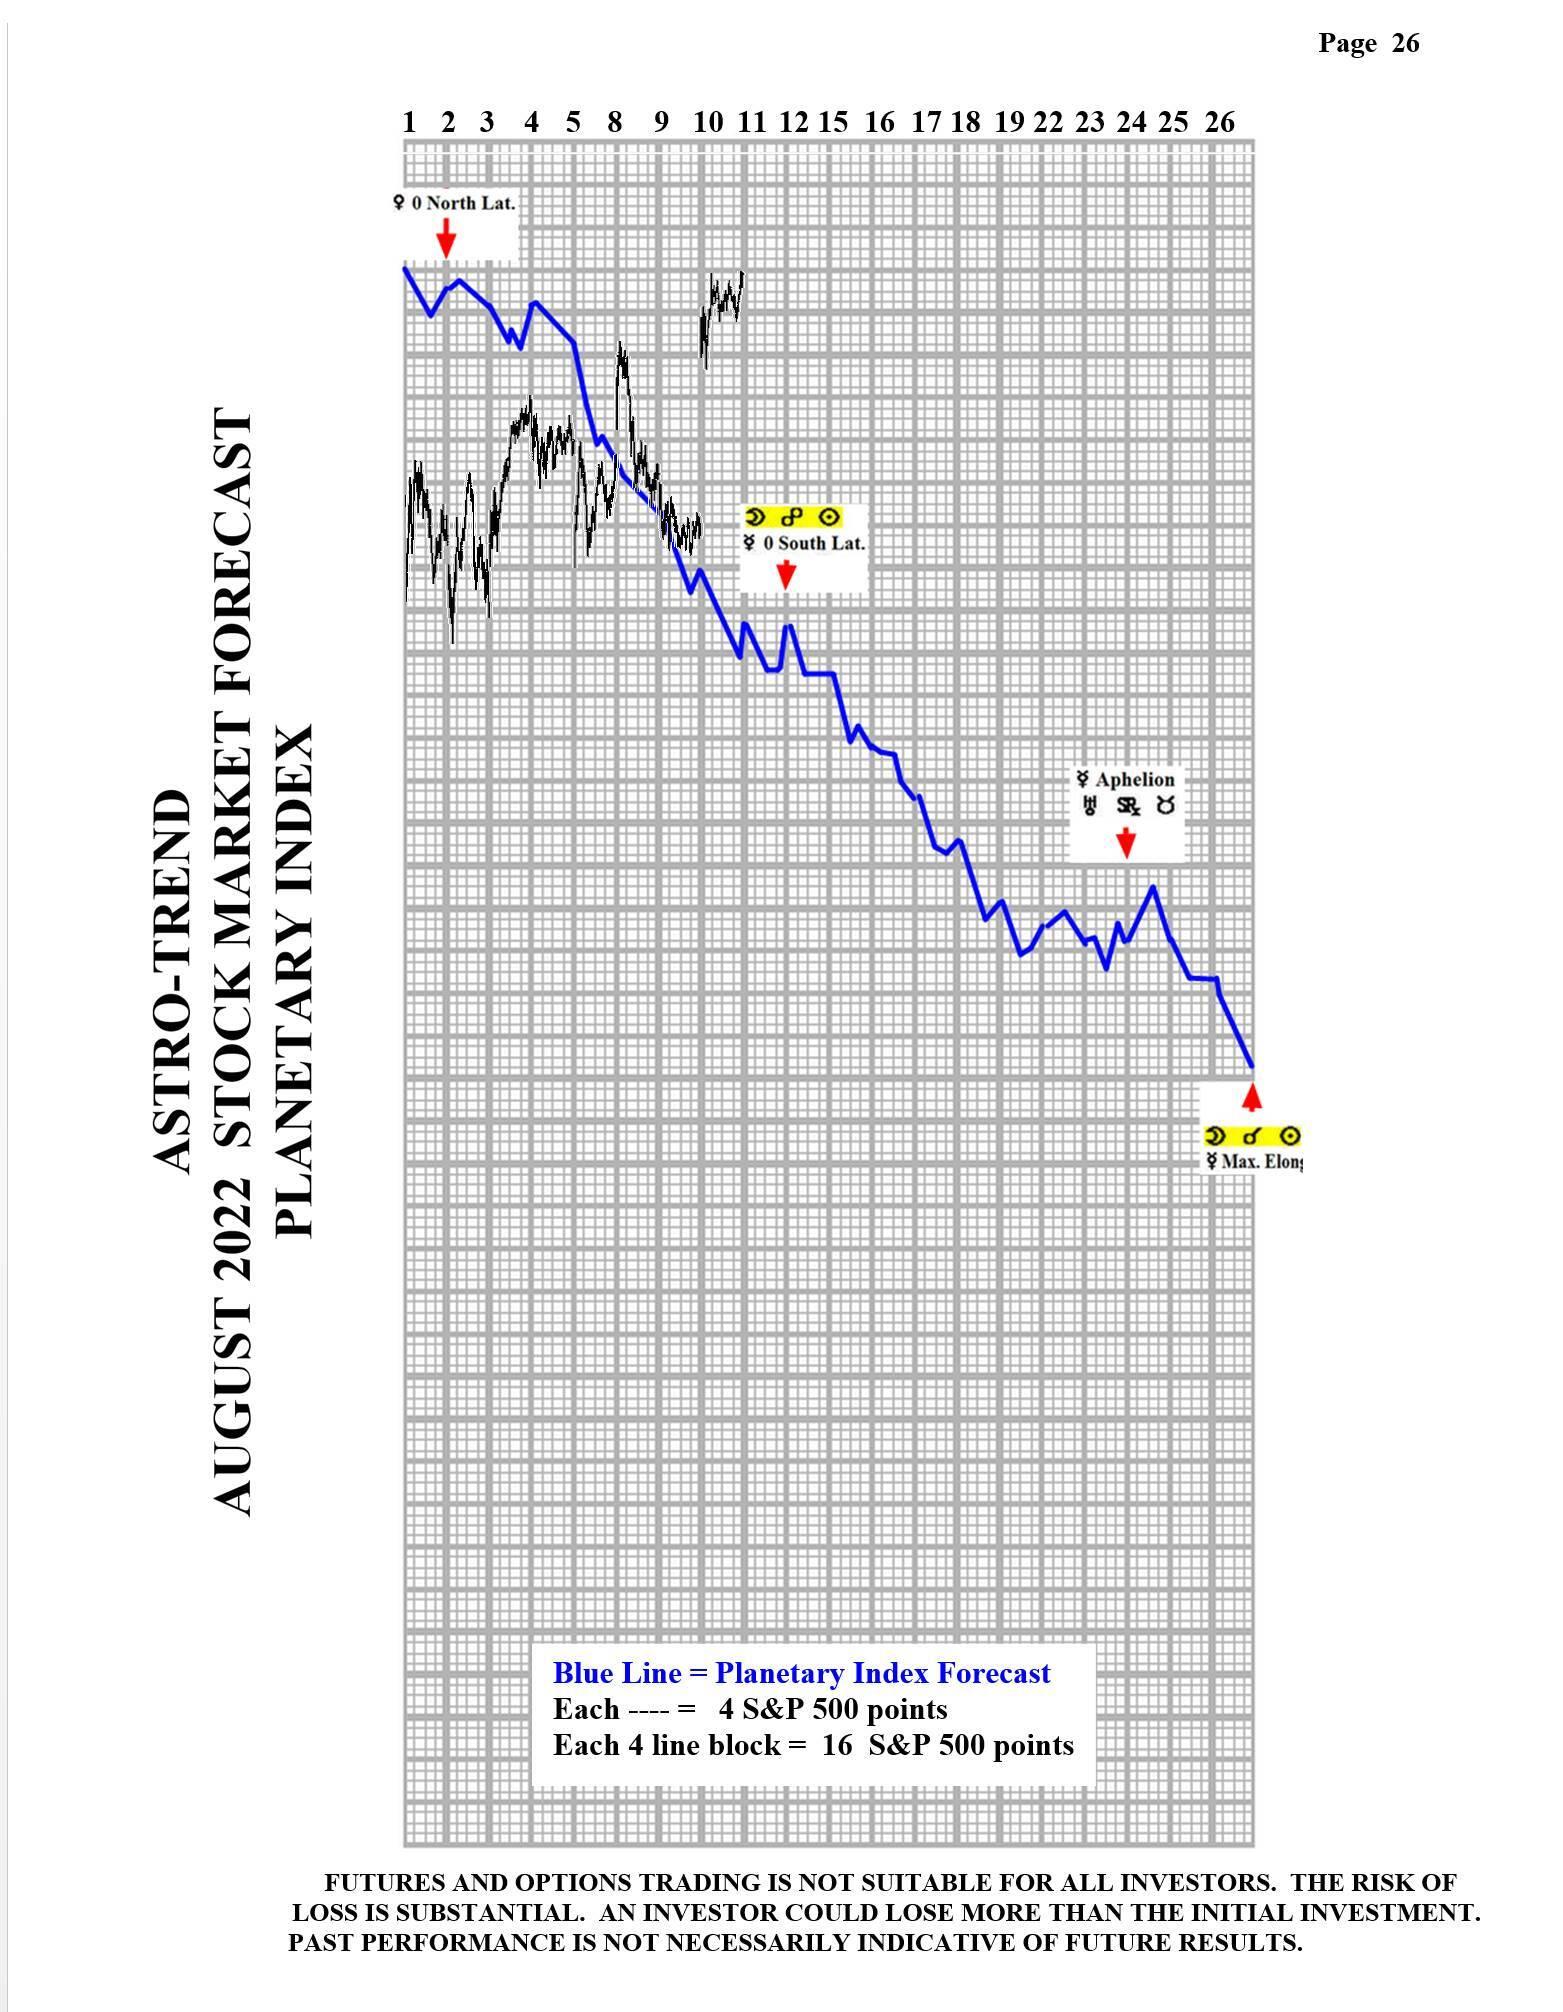
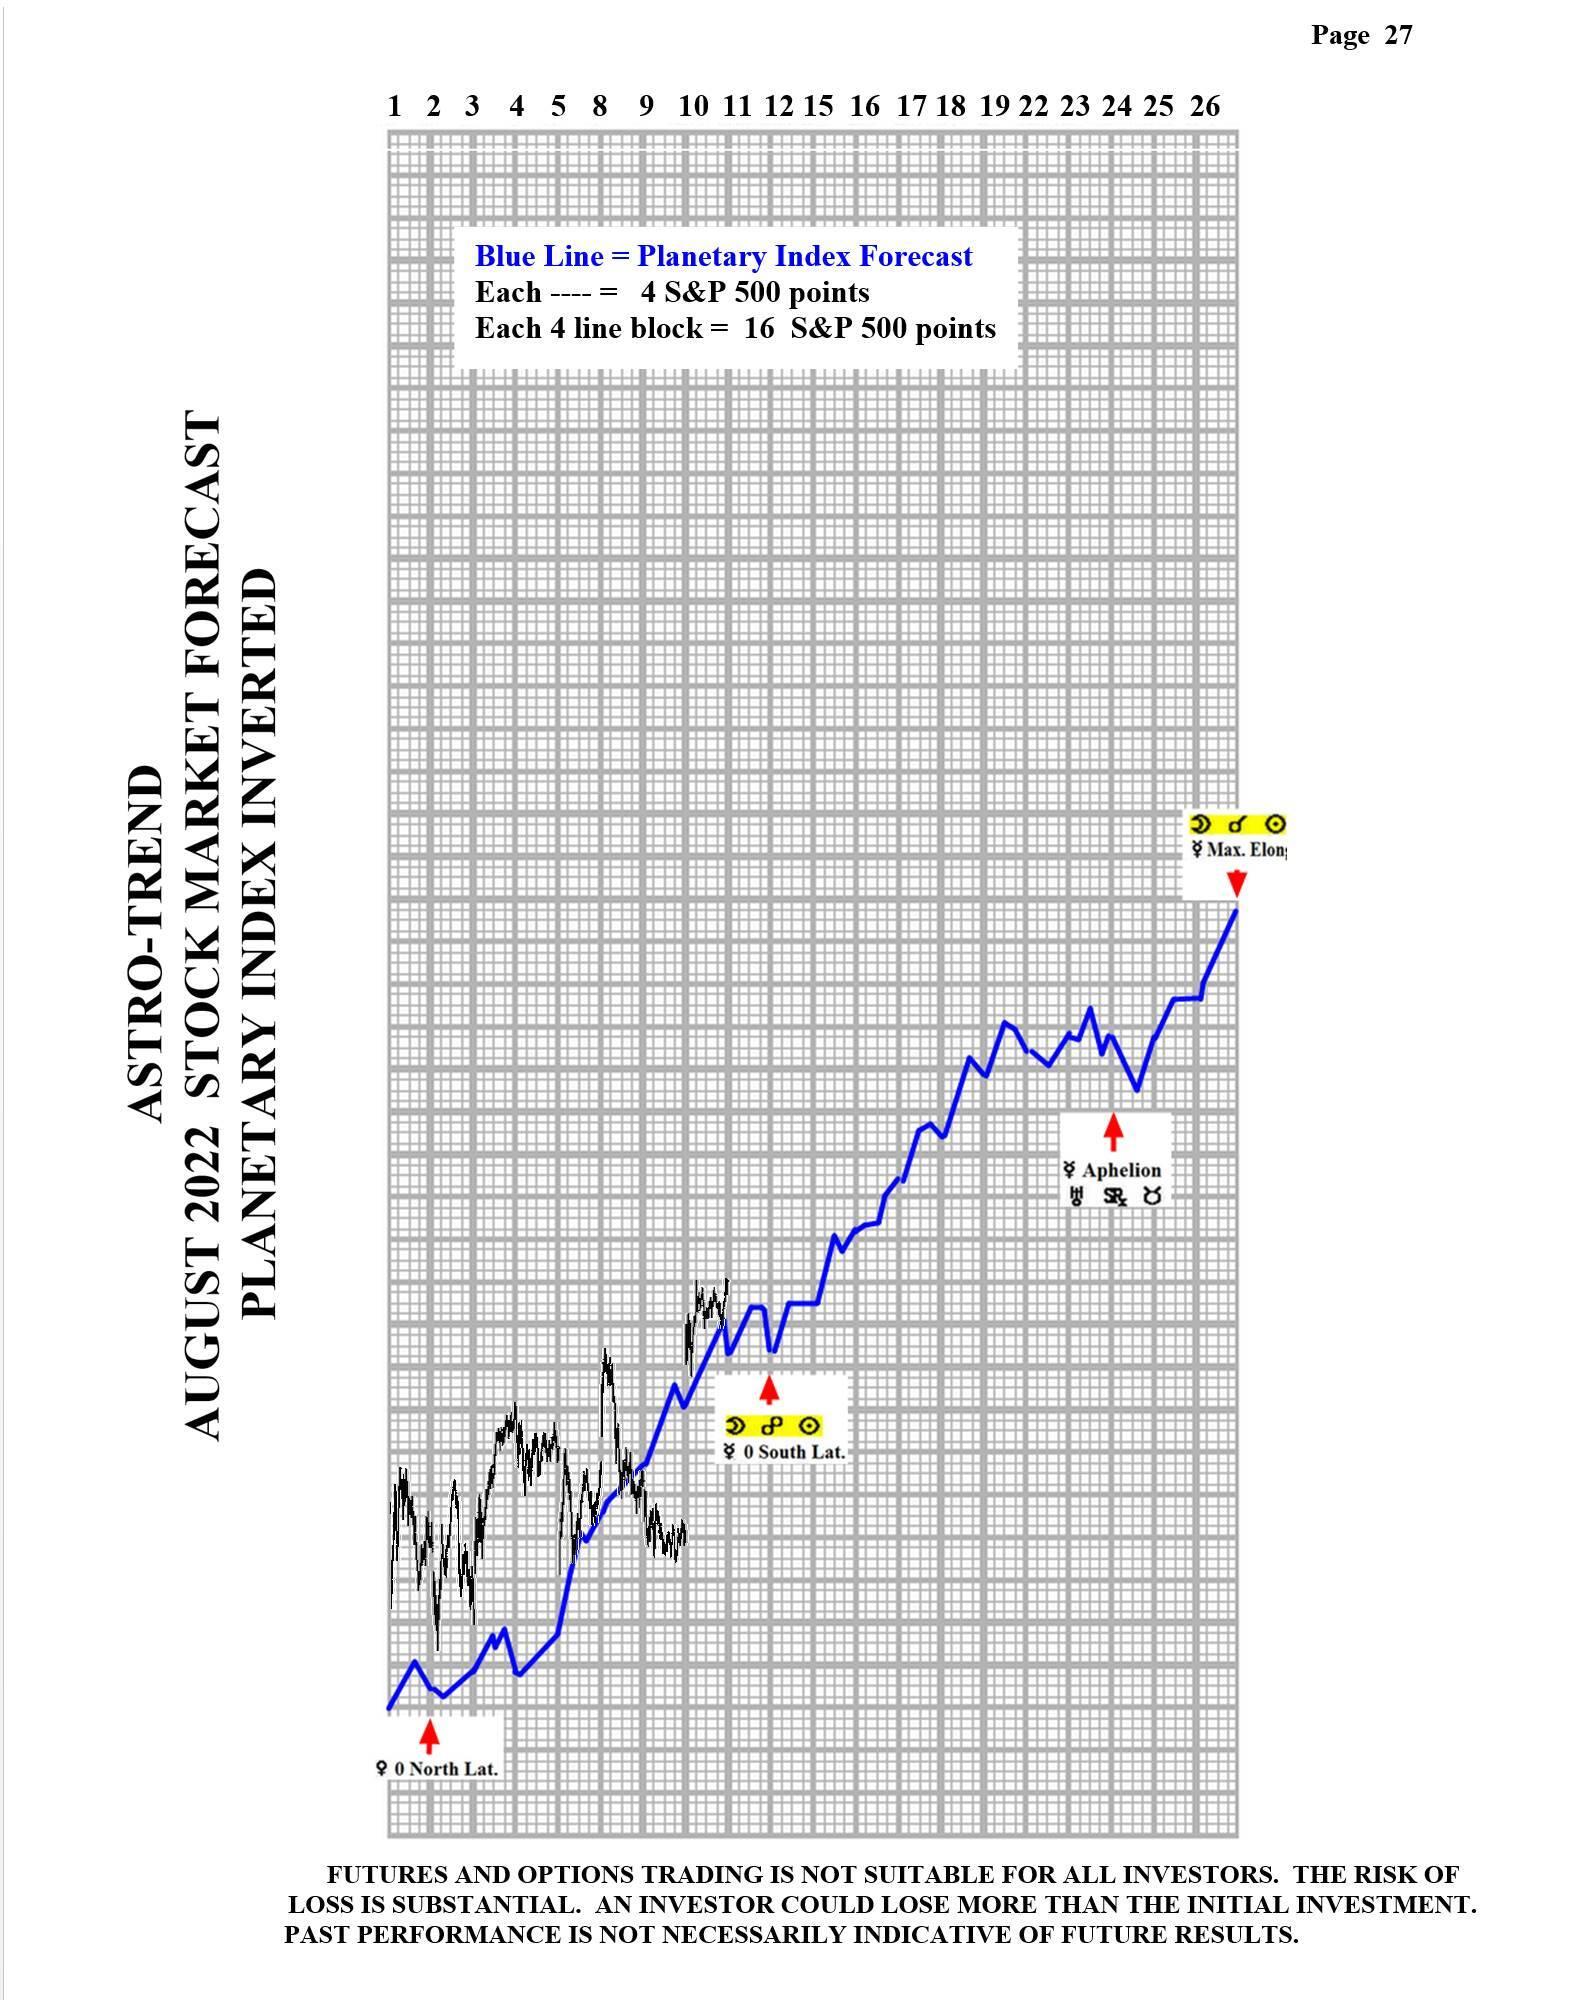
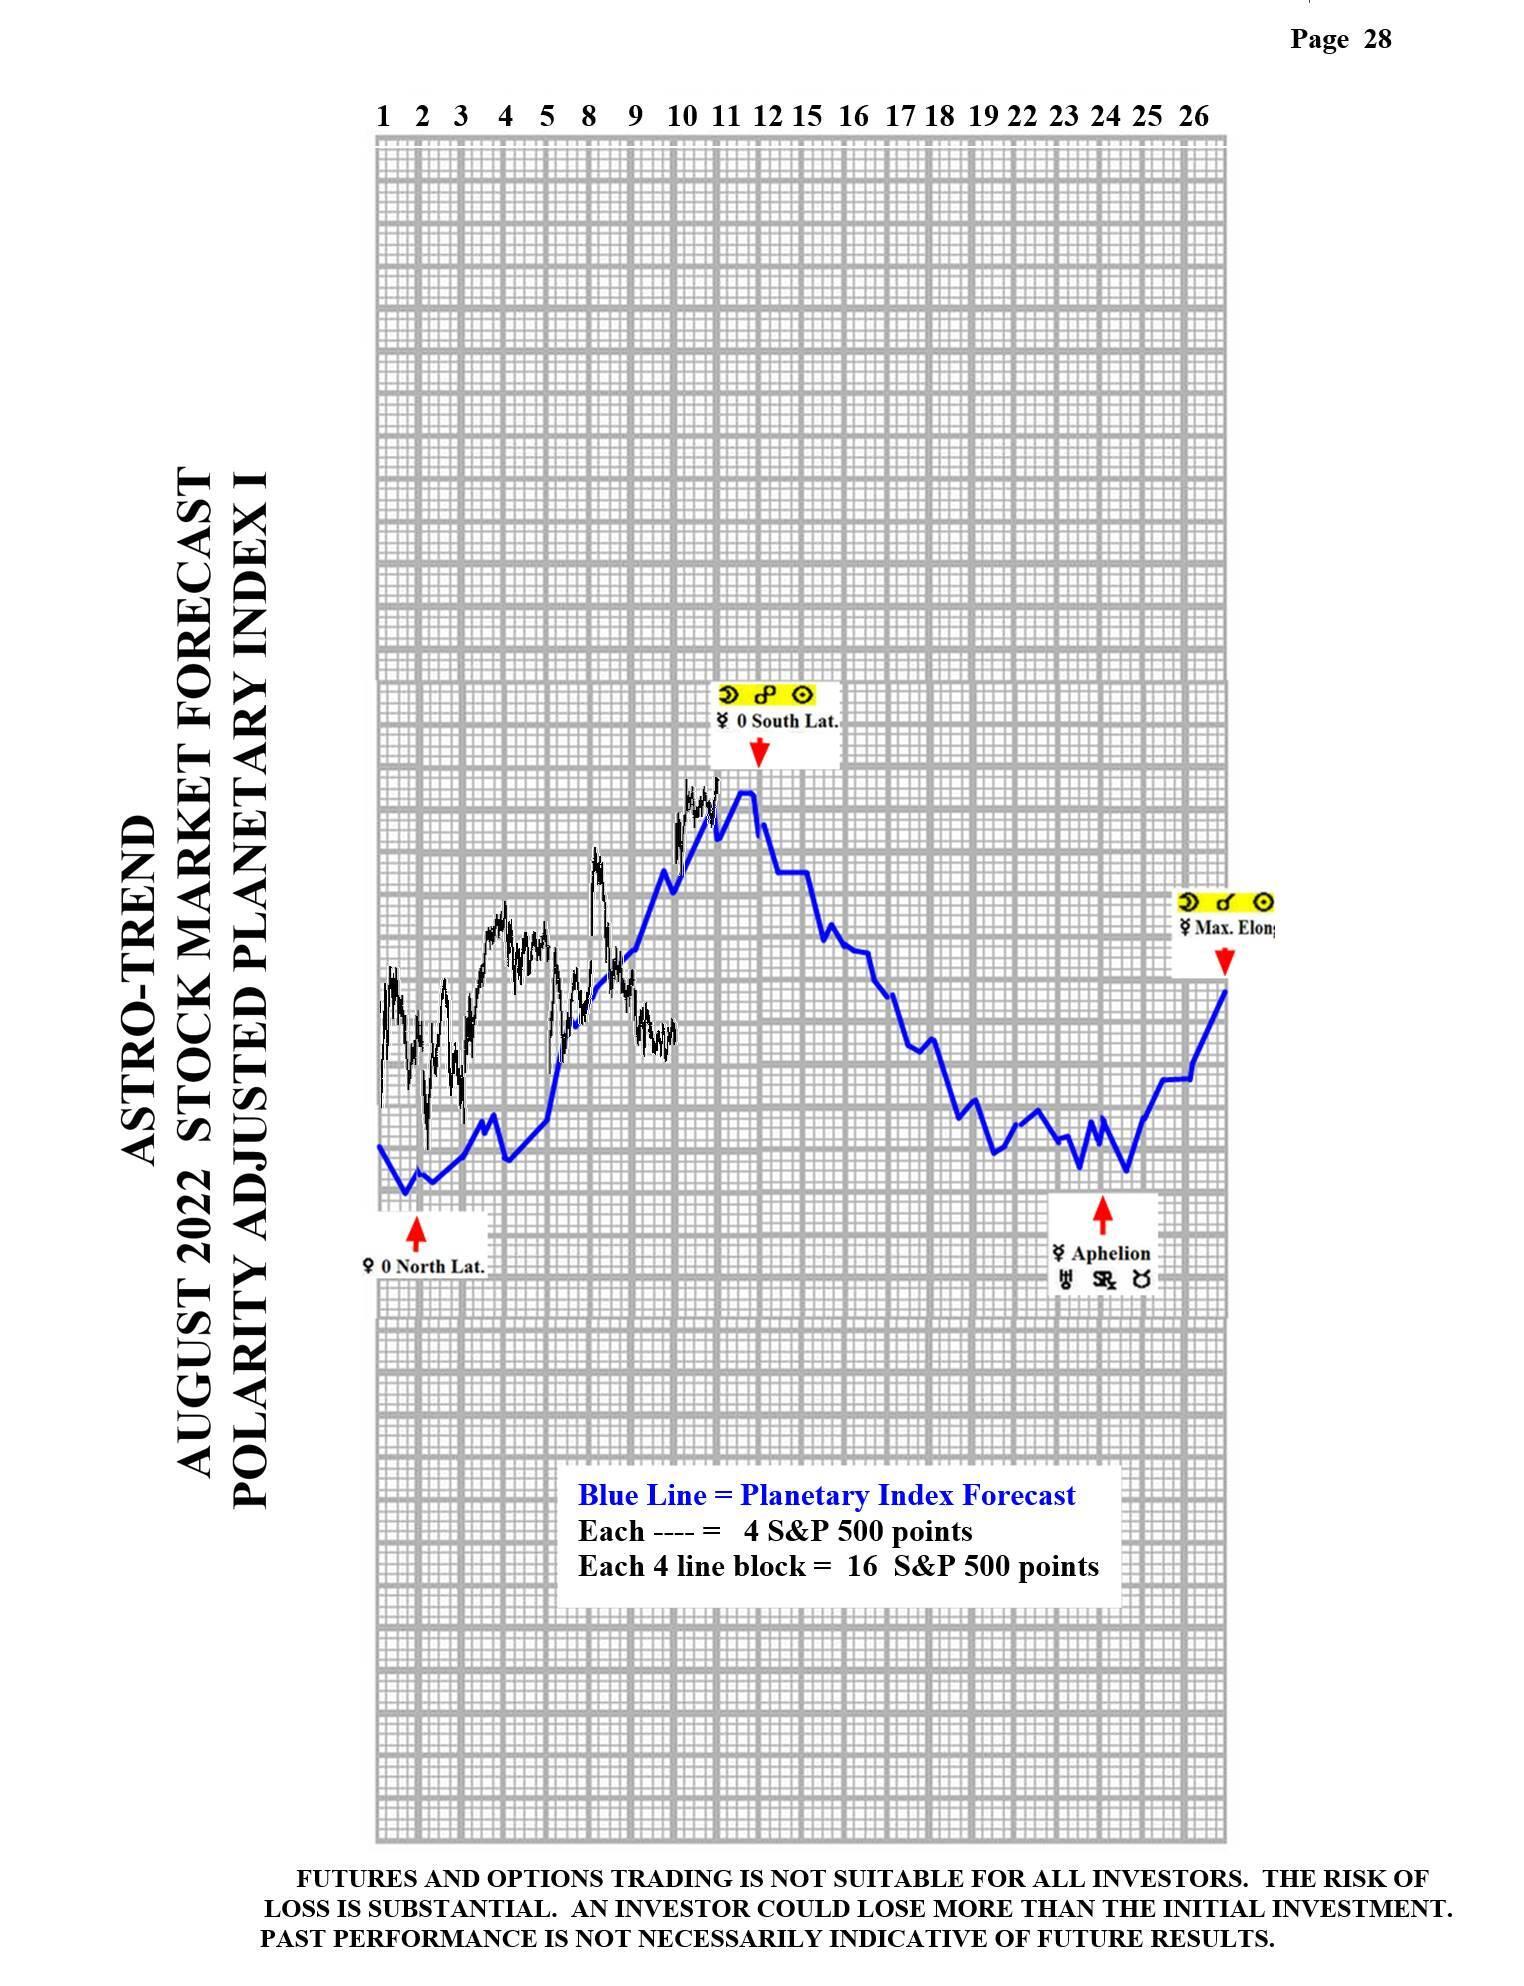
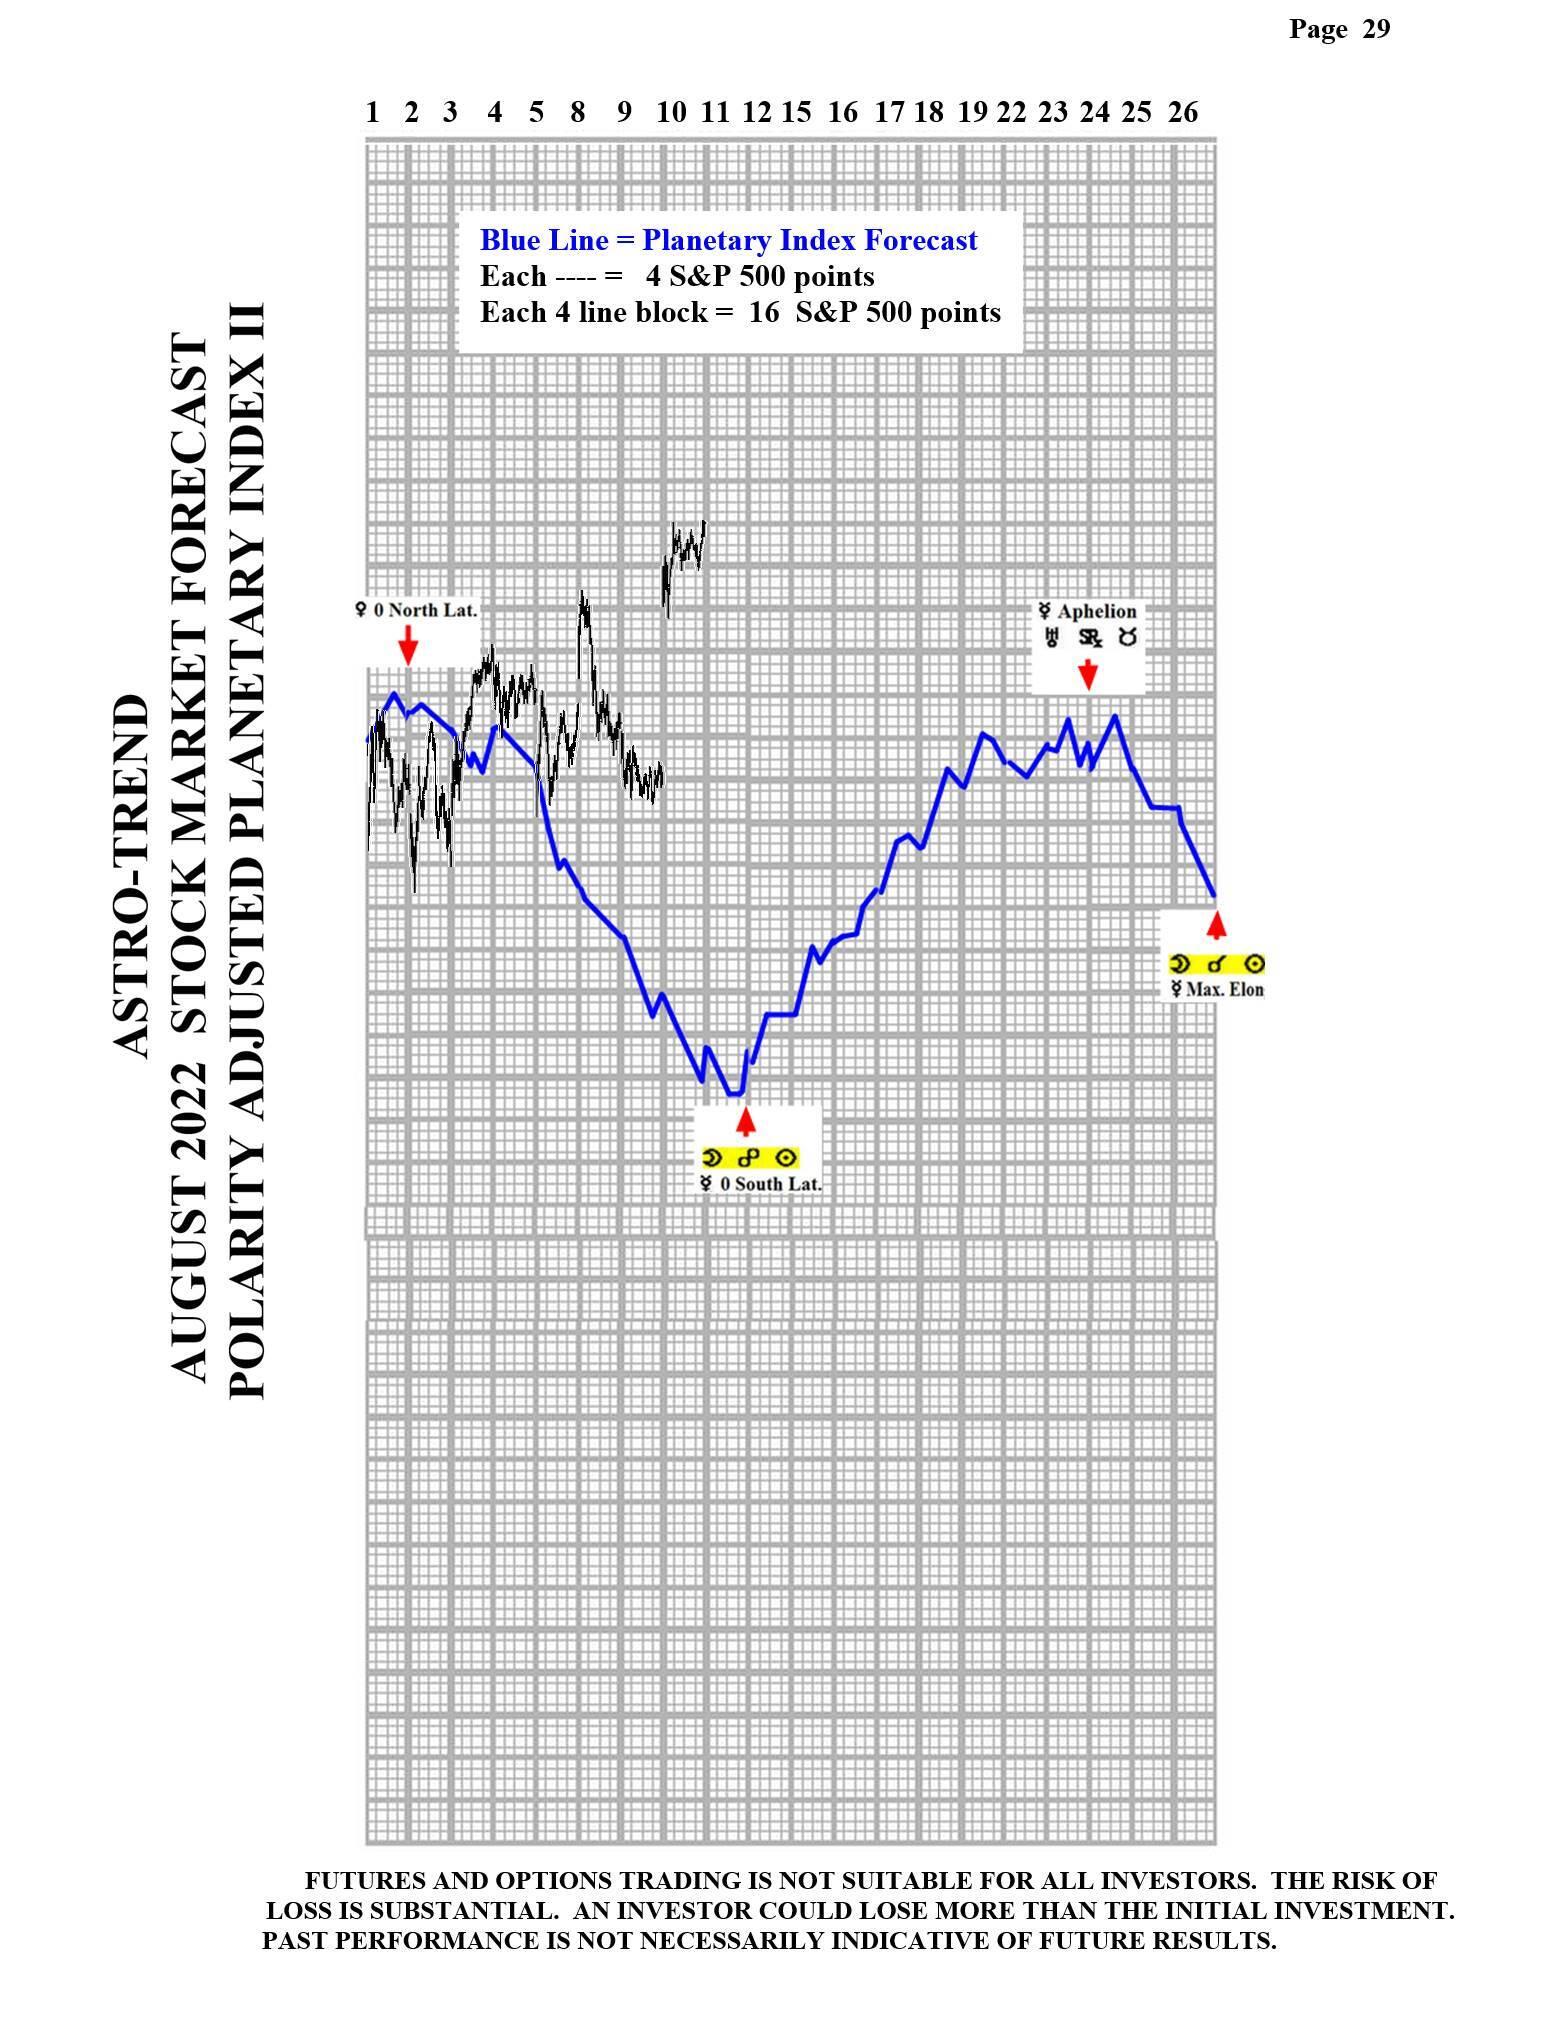
Please see below the August Planetary Index chart with S&P 500 5 minute bars for results.
Author

Norm Winski
Independent Analyst
www.astro-trend.com


