The inflation gap nobody is watching yet
The Iran war is reviving painful memories for the Fed as costs related to energy, shipping, food and semiconductor materials are all surging at once. The question is no longer whether rising producer costs will bleed over into consumer prices, but when: what businesses are paying today will likely hit US consumers’ wallets very soon.
There is a one-percentage-point gap between what US businesses are paying for inputs and what consumers see at the checkout. That gap has been widening since late 2025, and the war in Iran is poised to fuel it even further.
The conflict has amplified the divergence by feeding cost pressure into the pipeline from multiple directions: shipping insurance through the Strait of Hormuz has surged; global fuel and fertilizer prices have spiked; and a helium shortage now threatens semiconductor production in a matter of months, if not weeks.
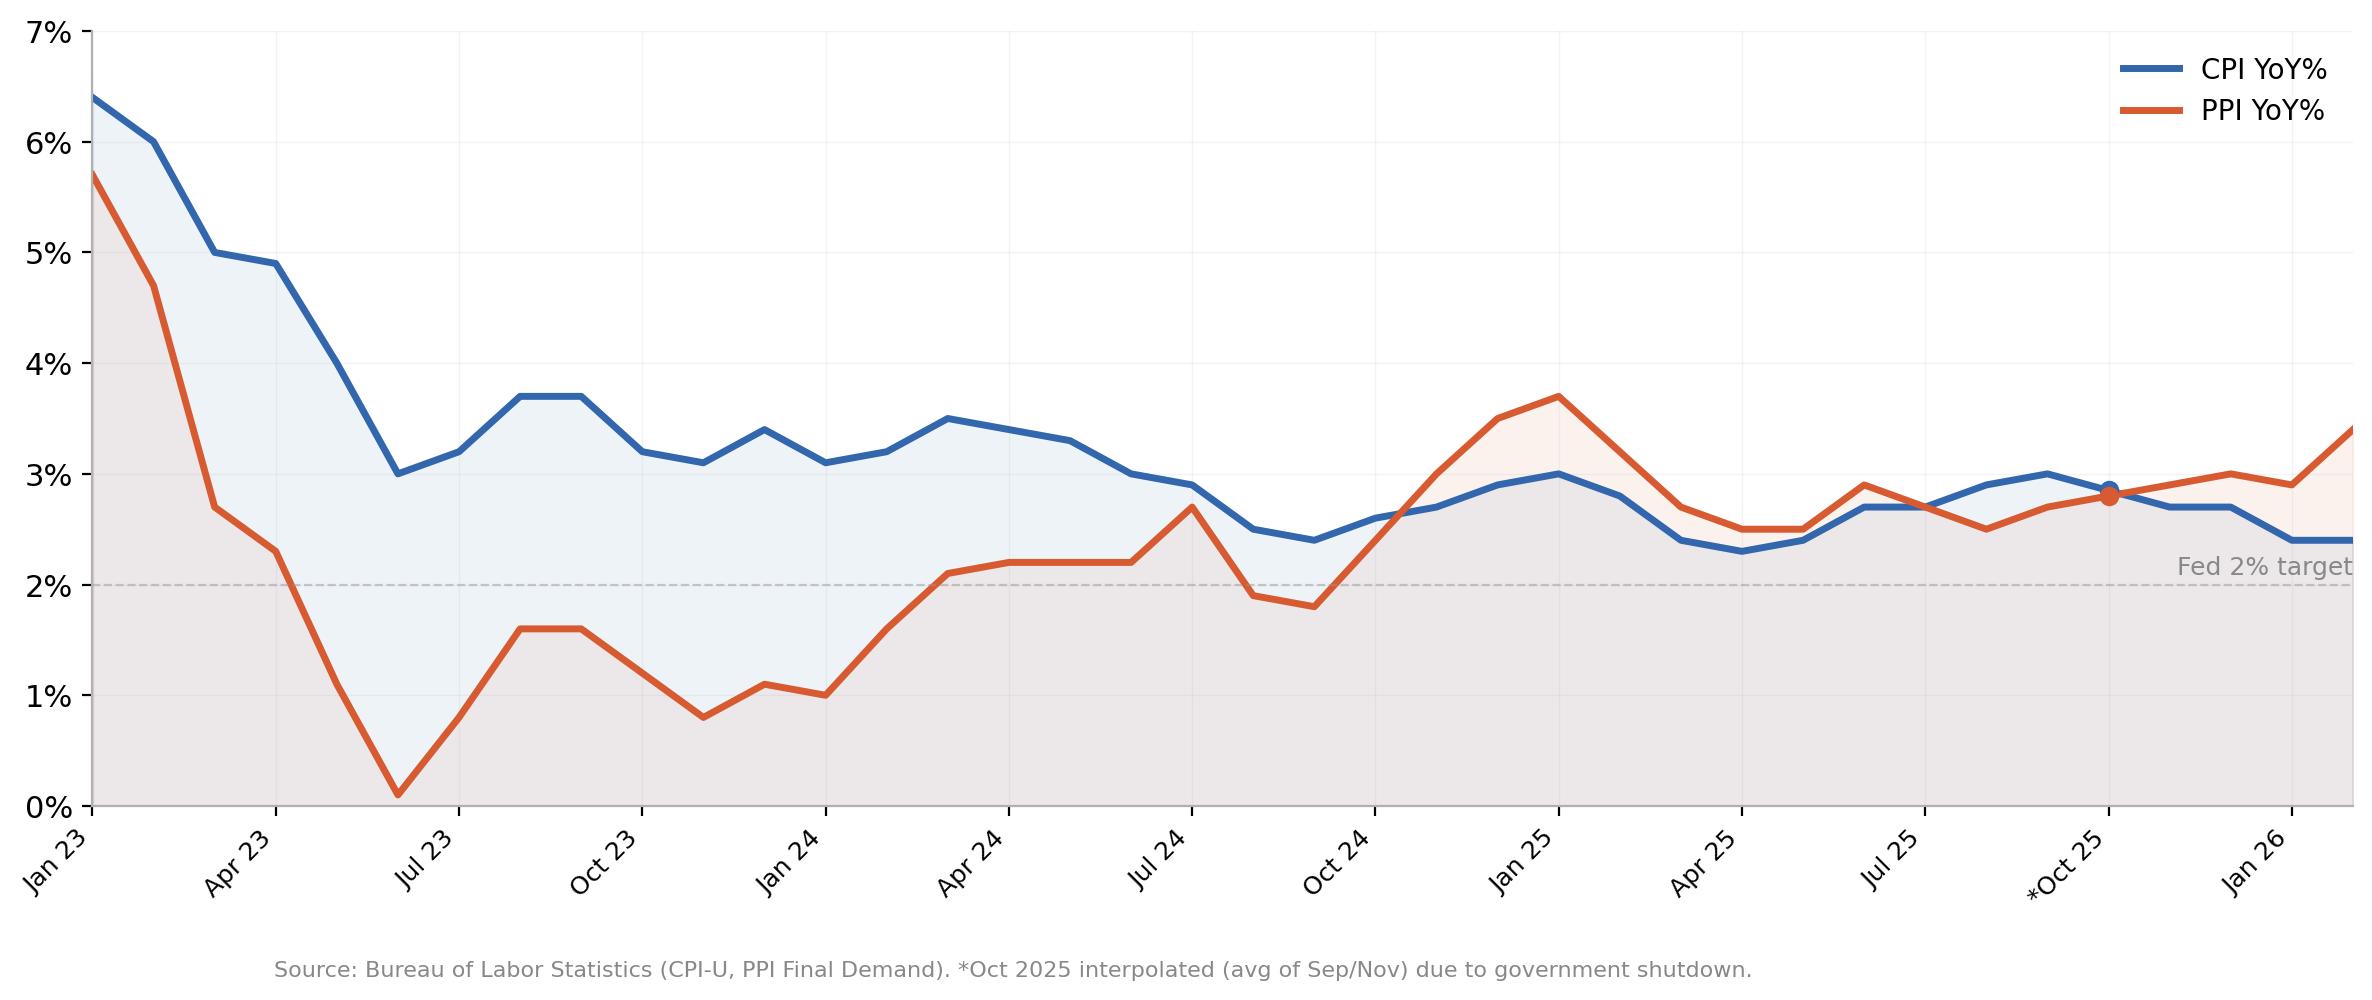
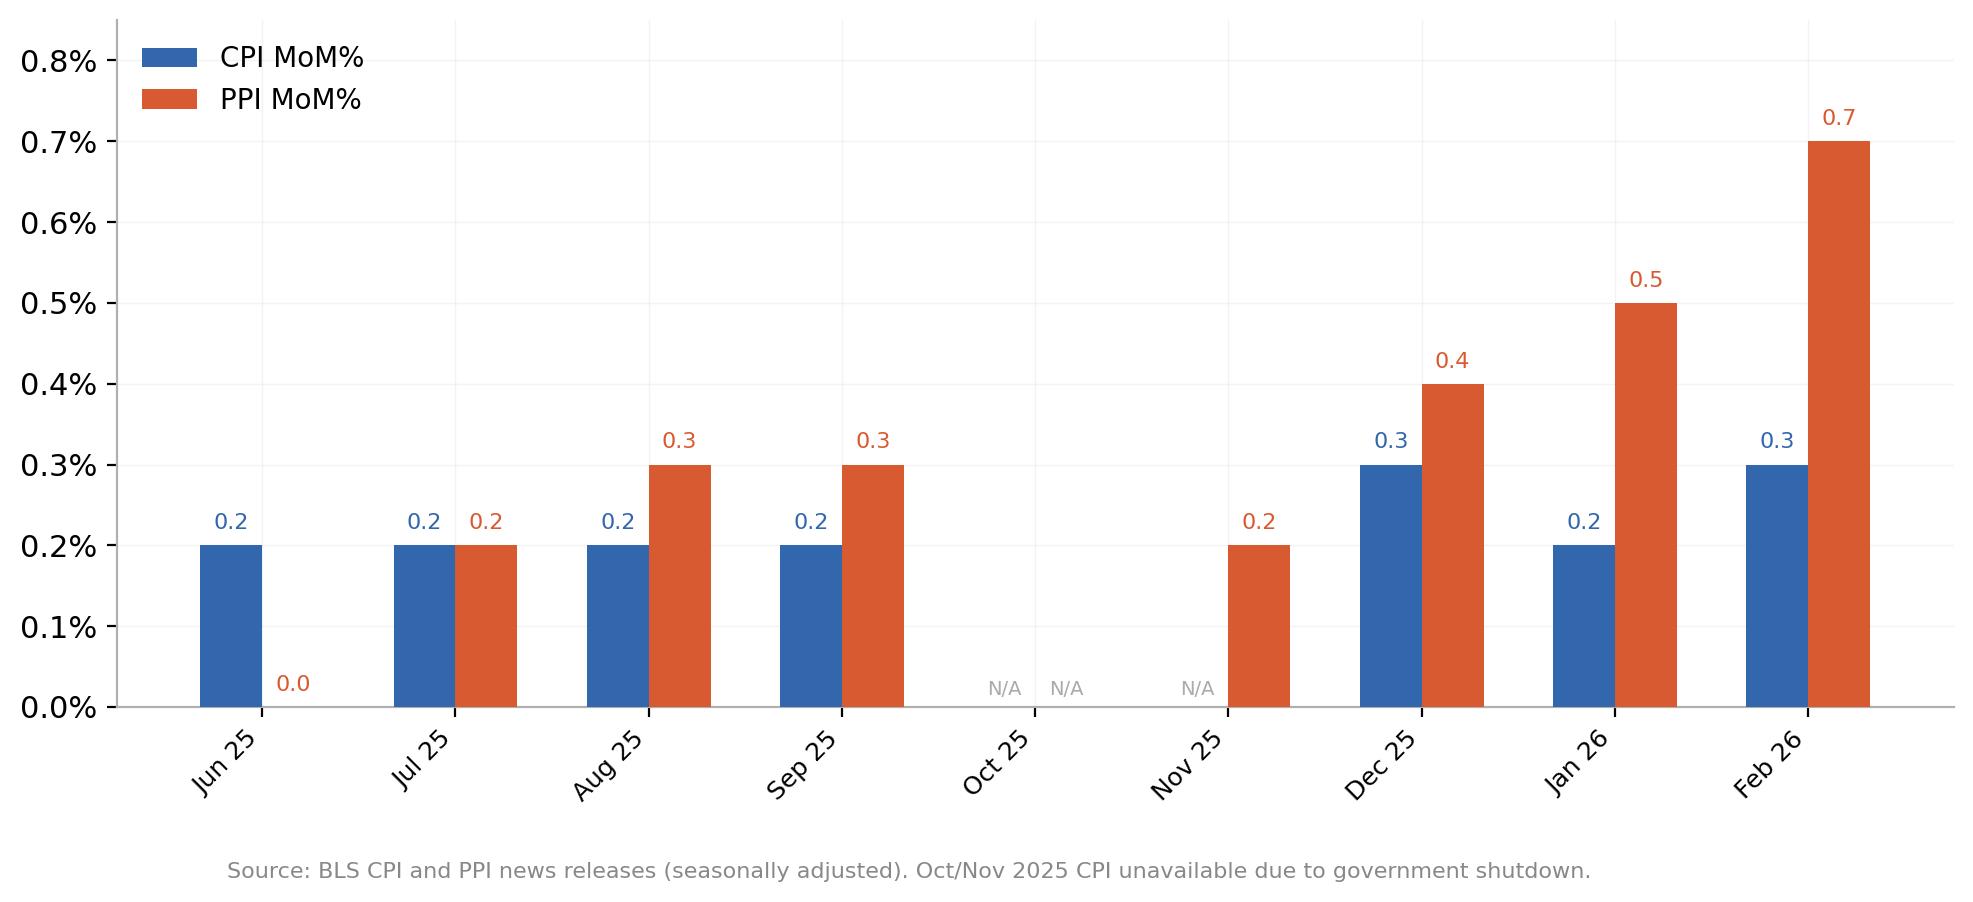
The Bureau of Labor Statistics (BLS) reported February’s Producer Price Index (PPI) inflation at 0.7% MoM, more than twice the consensus forecast of 0.3%, while Consumer Price Index (CPI) inflation remained moderately tepid (albeit above-target on an annualized basis) at 0.3%.
Under normal circumstances, this kind of divergence typically sparks a debate about whether producer prices lead consumer prices. But these are not normal circumstances.
The pipeline everyone believes in
The idea is intuitive: Raw material costs rise, producers absorb what they can, and eventually pass the rest downstream. Wholesale margins tighten, retail prices follow, and the CPI prints hotter a few months later. The PPI is frequently described as a "leading indicator" of consumer inflation, the early warning siren that sounds before the CPI confirms the fire. Traders have leaned on this framework for years.
The problem is that the academic evidence is mixed at best. A seminal 1995 study out of the Kansas City Federal Reserve (Fed) found only a weak relationship between changes in producer prices and subsequent movements in consumer prices. A 2022 Richmond Fed paper revisited the question and reached a more nuanced conclusion: there is a statistically significant long-run relationship between the two, and gaps between PPI and CPI do tend to close over time, but the short-run predictive power remains limited. The St. Louis Fed's FRED Blog put it more bluntly, noting that economists have generally found PPI "does not forecast" CPI.
But the research also reveals an important caveat: The pipeline tends to work better during periods of broad, persistent supply-side pressure. When producer costs are rising across multiple categories simultaneously, and when those cost increases are structural rather than transitory, the pass-through to consumers becomes harder to avoid. That caveat matters enormously right now.
Four years of mixed signals
Strip out the pandemic-era spike and focus on 2023 onward, and the pipeline theory looks shaky. PPI YoY collapsed from around 6% in January 2023 to near zero by mid-year. CPI barely flinched, still printing above 3% when PPI had already flatlined. The culprit was shelter, which makes up roughly 36% of the CPI basket and was running above 5% annualised through much of 2023. There is no equivalent component in the PPI. The pipeline sprang a massive leak right where it was supposed to be most useful.
By 2024, the two measures converged into a similar range, neither clearly leading the other. That did not last. Through 2025, PPI maintained a persistent premium over CPI, and then came the late-year acceleration: monthly PPI prints accelerated through February, while CPI stayed pinned near 0.2%-0.3%. The gap was back, and then the war started.
Food is the canary, and fertilizer just made it worse
If there is one category where the PPI-to-CPI pipeline operates with reasonable reliability, it is food. The US Department of Agriculture's Economic Research Service has noted that industry-level PPI segments for foods and feeds "have historically shown a strong correlation" with the consumer-level food CPI. The lag tends to be short, often just one to two months, because the supply chain from farm gate to grocery shelf is relatively direct.
The February data already shows the pipeline in play, with farm-level cattle prices up 20% YoY. Fresh and dry vegetable prices in the PPI spiked nearly 49% in a single month, while the food-at-home CPI subcategory rose 0.4%, with fruits and vegetables alone up 1.4%. The USDA forecasts food-at-home prices to rise 3.1% for the full year of 2026, well above the 20-year historical average of 2.6%.
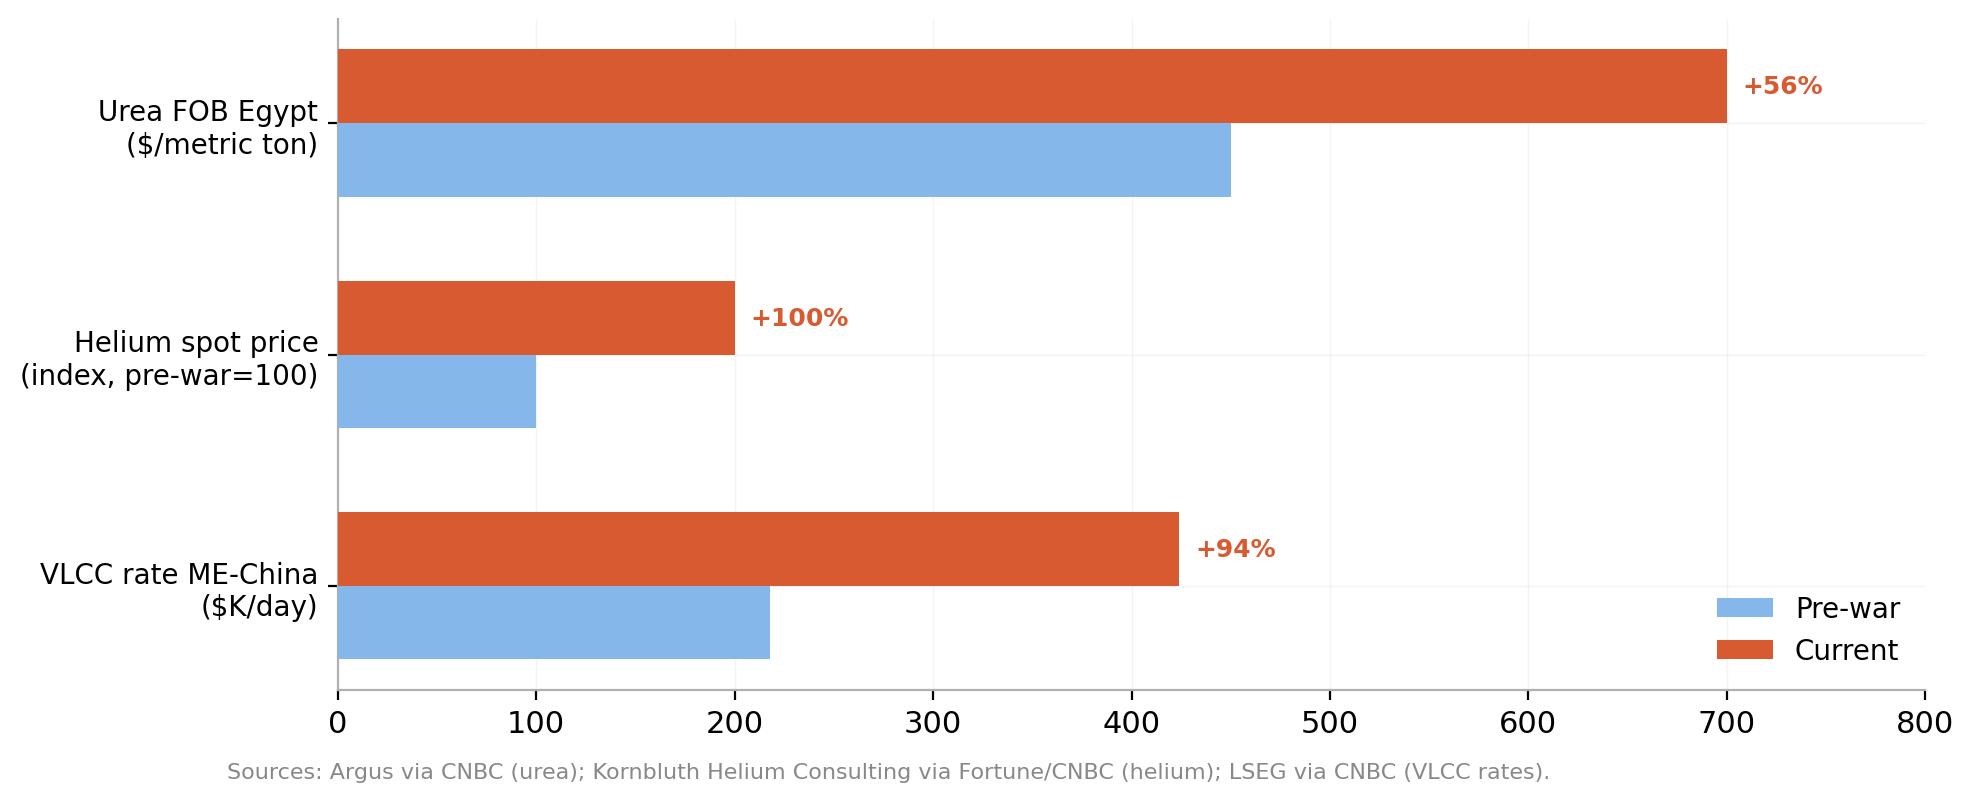
And then the fertilizer market blew up. Nearly half of all globally traded urea and roughly 30% of ammonia exports come from Gulf states whose shipments transit the Strait of Hormuz. With the Strait effectively closed since early March, urea prices have surged from around $450 per metric ton before the missiles started flying to approximately $700, a jump of about 45% in a matter of weeks.
QatarEnergy shut down downstream urea production after halting its liquid natural gas (LNG) operations, and China has restricted fertilizer exports to protect domestic supply. The Fertilizer Institute estimates US farmers will be short roughly 2 million tons of urea this spring.
The timing could not be worse with the Northern Hemisphere planting season in full swing from mid-February to early May. Nitrogen fertilizer is not optional for corn and wheat growers, as it accounts for one-third to one-half of operating costs.
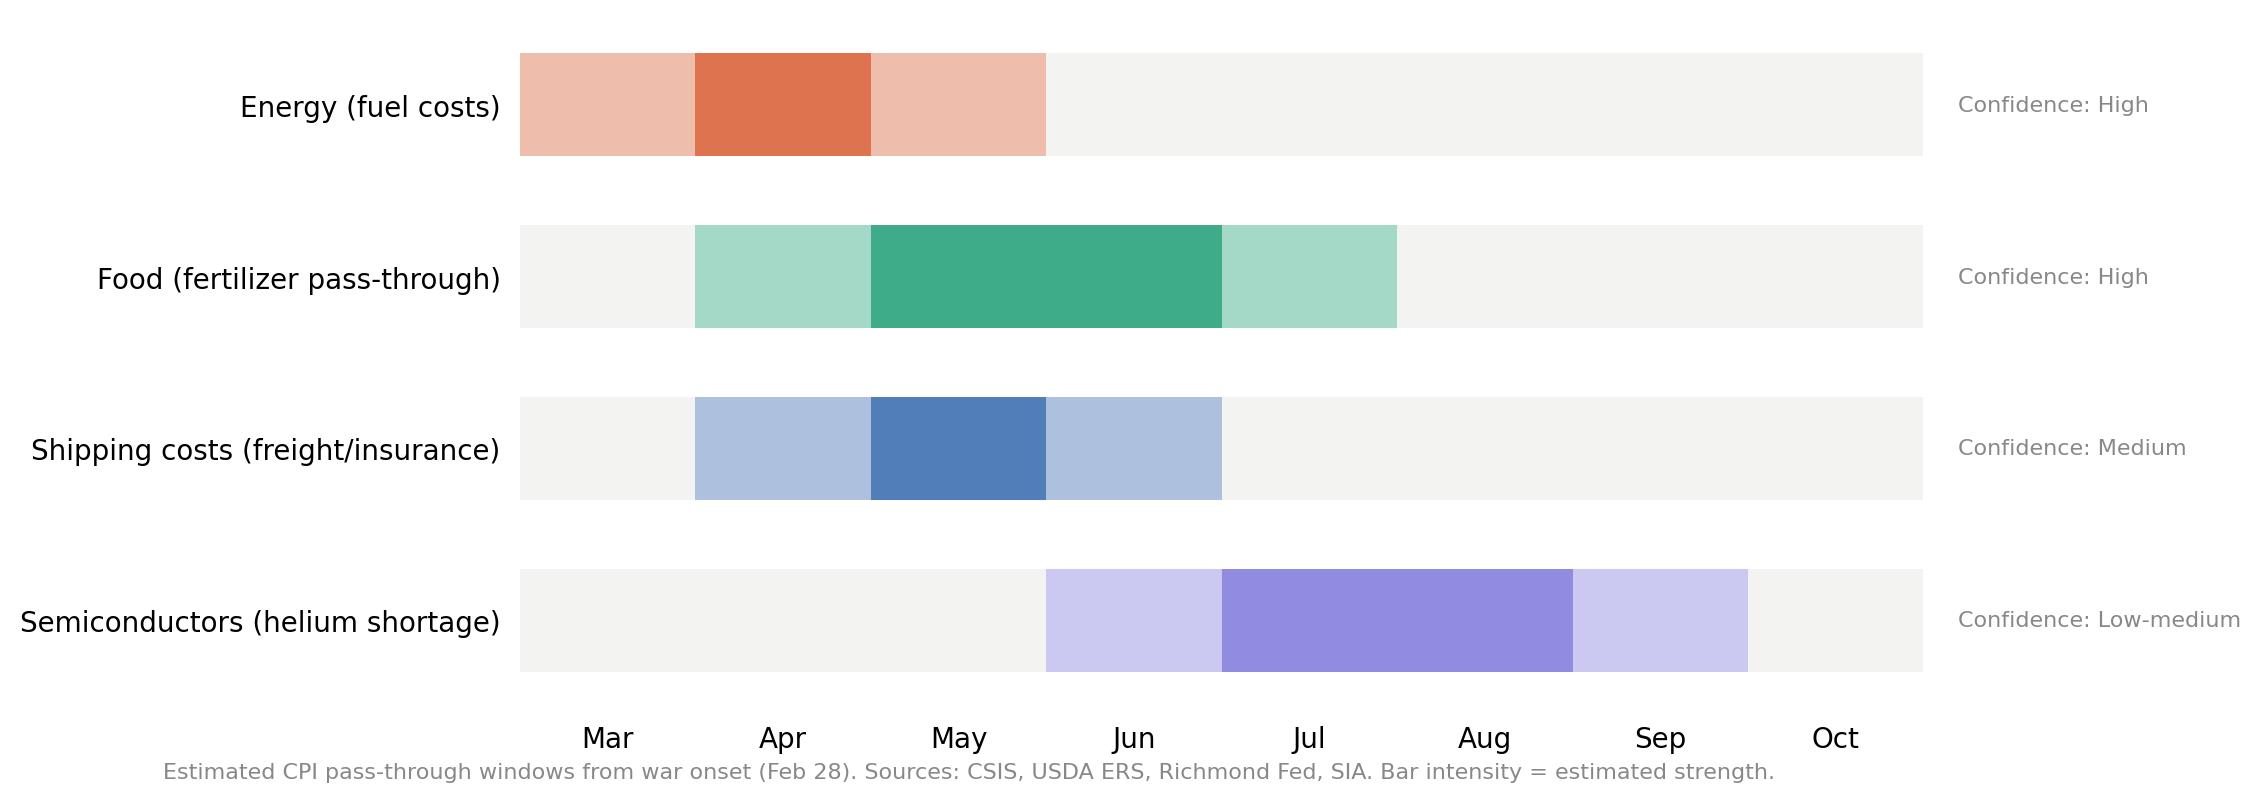
If fertilizer prices remain elevated, farmers will either absorb the cost and raise crop prices, or reduce acreage, which also raises crop prices by constraining supply. Both paths feed directly into food CPI. The Center for Strategic and International Studies (CSIS) estimates that the food-price impact of elevated energy prices could peak approximately four months after the onset of the war, placing the sharpest consumer-side pressure somewhere around June or July.
A supply shock hitting from every direction
The PPI-CPI pipeline has always been leaky under normal conditions. What makes the current environment different is that producers are not facing a single-channel cost shock. They are being hit from at least four directions at once, and the war in Iran is behind most of them.
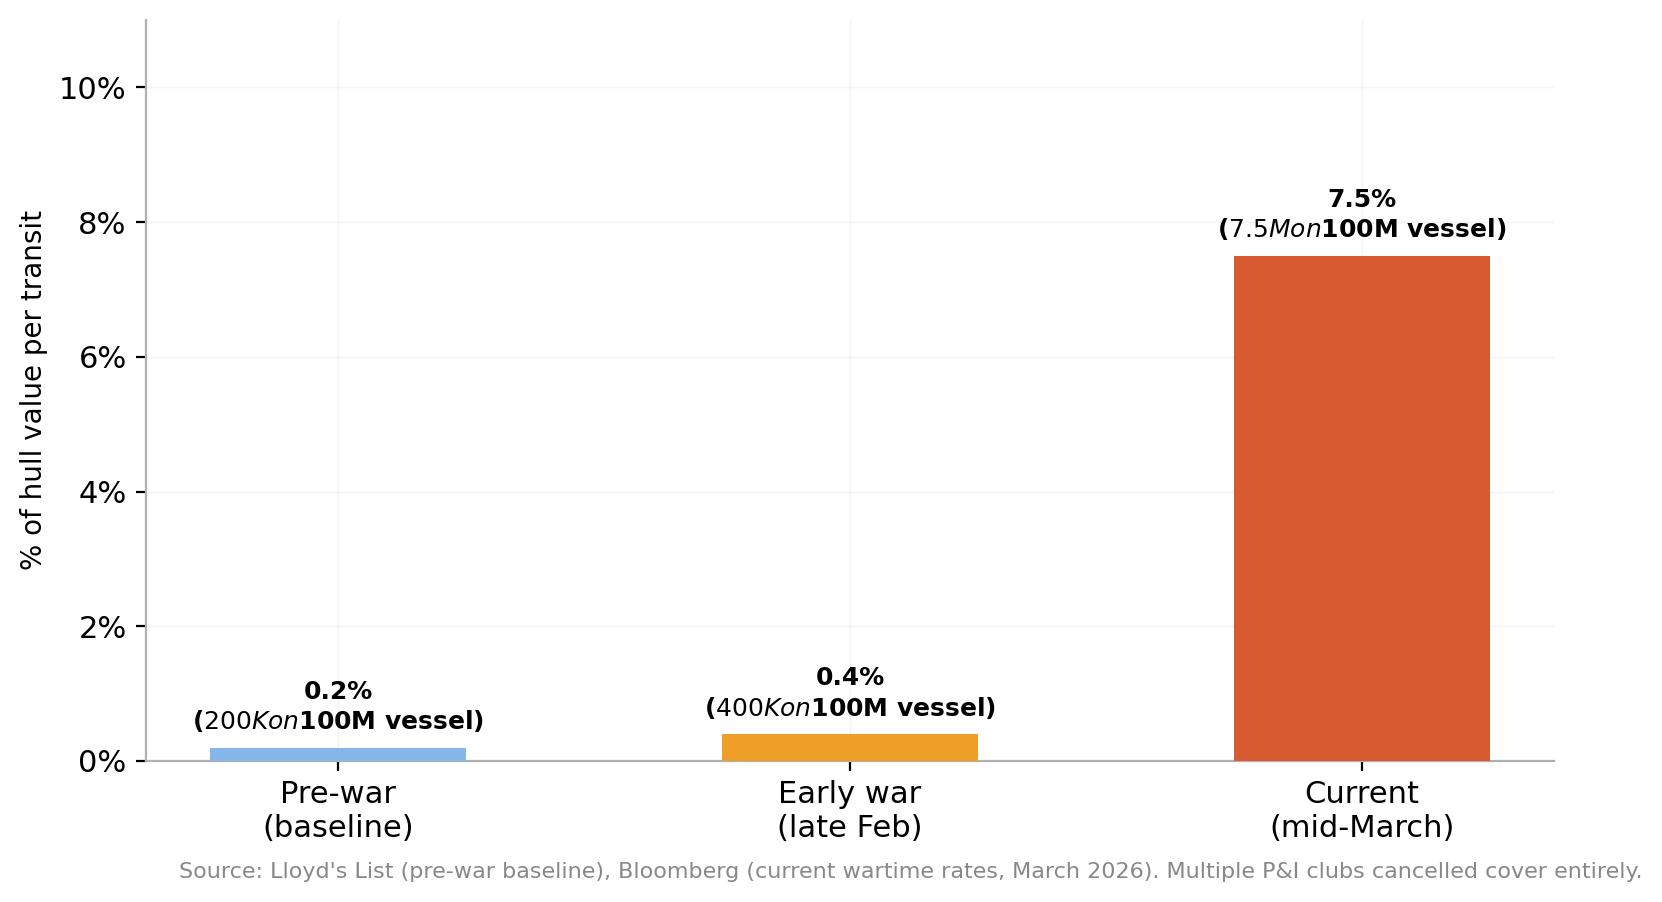
Shipping costs have gone vertical. War risk insurance premiums for vessels transiting the Strait of Hormuz have surged from around 0.15% to 0.25% of hull value before the conflict to as high as 5% to 10%, according to Lloyd's List. For a large crude carrier worth $100 million, that adds up to $5 million in insurance costs for a single voyage. Hapag-Lloyd implemented a war risk surcharge of up to $3,500 per container as of March 2.
Benchmark freight rates for very large crude carriers on the Middle East-to-China route hit an all-time record of nearly $424K per day in the first week of the conflict, a 94% increase in a single session. These costs do not disappear when the ship docks. They embed into the landed cost of every physical good that touches the Gulf shipping corridor, from crude Oil to chemicals to finished products.
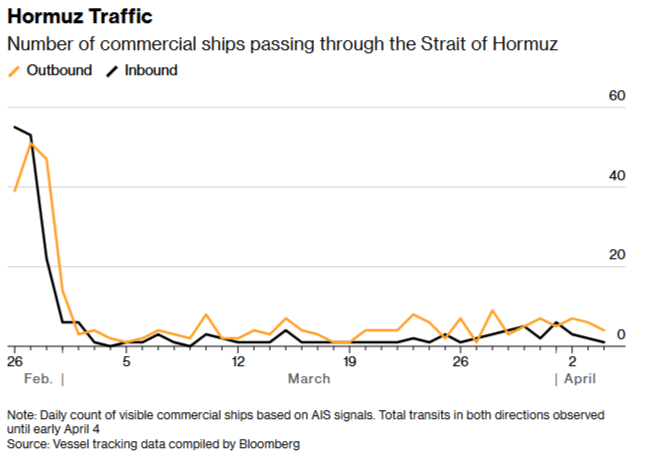
Global fuel costs are soaring independently of the shipping premium. The Strait of Hormuz normally carries roughly one-fifth of the world's Oil and a similar share of global LNG flows. With daily transits down 90% to 95% since the conflict began, crude prices have pushed above $100 per barrel.
QatarEnergy reported that Iranian strikes wiped out 17% of the country's LNG export capacity, with repairs potentially taking three to five years. Energy is an input to virtually everything. The February PPI data already showed processed energy goods up 5.5% and unprocessed energy materials up 6.0% in a single month, before the full impact of the Hormuz closure had filtered through.
Then there is helium. Qatar produces roughly one-third of the world's supply, and that output went offline when Iranian strikes hit QatarEnergy's Ras Laffan facility in late February. Spot helium prices have doubled since the crisis began.
Around 200 specialised containers used to transport helium are stranded in the Strait. The global supply chain operates on roughly 45 days of buffer before existing liquid inventory boils off. This matters because the semiconductor industry has overtaken medical imaging as the largest consumer of helium, which is used to cool wafers during chip fabrication and is irreplaceable in photolithography. Helium suppliers are already issuing force majeure notices to US-based customers.
The chip angle is a slow-burner, but potentially the most consequential for the PPI-CPI pipeline. Consumer electronics, automobiles, and AI infrastructure all depend on semiconductor supply. If helium shortages begin constraining chip production at TSMC, Samsung, and SK Hynix over the coming months, the resulting scarcity would feed into durable goods prices with a three- to six-month lag, precisely the kind of delayed pass-through that the pipeline theory predicts but rarely gets to demonstrate. The Semiconductor Industry Association warned in a 2023 filing that if helium supply were disrupted, "there would likely be shocks to the global semiconductor manufacturing industry." That hypothetical is now a reality.
What the gap means for the Fed
The Fed held rates at 3.50% to 3.75% at its March meeting, with the Federal Open Market Committee (FOMC) voting 11-1 to hold, and the updated dot plot is now projecting just a single rate cut for the remainder of 2026. The CME FedWatch Tool shows a 95% probability of another hold at the Fed’s April interest rate call, and the market sees it as more likely than not that rates will stay exactly where they are through year-end, a stark reversal from late 2025 when futures were pricing two or three cuts.
The four-year post-pandemic track record, in isolation, would suggest caution about reading too much into the PPI-CPI gap. The pipeline was leaky in 2023 because shelter kept CPI elevated while PPI collapsed. It was irrelevant in 2024 because both measures converged. Under normal circumstances, the current divergence could simply reflect temporary margin compression that businesses absorb without raising consumer prices.
But the Iran war has changed the calculus. Tariffs alone were already embedding structural cost increases into the goods supply chain. Layering on a multi-front supply shock, one that simultaneously hits shipping, energy, food inputs, and semiconductor materials, makes margin absorption far harder to sustain.
Companies cannot eat rising costs across every input category at once. The pressure either shows up in higher consumer prices or in collapsing earnings, and both outcomes eventually reach the same destination: a harder job for the Fed.
The next CPI report for March lands on April 10 at 12:30 GMT. The March PPI follows on April 14. But the data that matters most for the pipeline question will not arrive for months. The fertilizer shock hits food CPI with a lag that CSIS estimates at roughly four months. The helium shortage, if sustained, would not constrain chip supply until mid-year at the earliest. The shipping cost pass-through will take time to ripple from freight invoices to retail shelves. February's PPI data captured the world before the Strait of Hormuz closed. The numbers that come next will begin to show how much of the shock producers have already absorbed, and how much is still working its way downstream.
For four years, the PPI-CPI pipeline has been unreliable. This time, the volume of pressure being fed into it may not give it a choice.
Author

Joshua Gibson
FXStreet
Joshua joins the FXStreet team as an Economics and Finance double major from Vancouver Island University with twelve years' experience as an independent trader focusing on technical analysis.