The Great Stock Overvaluing

In the past, I have shown that we were at the highs for key valuation indicators even though we were not for the current favorite: the Shiller CAPE P/E Ratio. That was 44 at the top in early 2000 and has been as high as 33 in 2018. CAPE means “cyclically adjusted for 10-year average earnings,” which is better, as earnings can be so volatile, especially around tops and downturns.
But I have in the past adjusted that further for the 10-year average GDP growth rates, as this bull market and recovery are far inferior to past ones, especially that 1991-through-2000 boom that saw 4% growth rates instead of 2%. Stock valuations are and should be higher when growth is higher. That adjustment showed that the market is currently substantially more overvalued than in 2000.
My other two favorite indicators are so because they can’t be manipulated as much by earnings and earnings per share. The first is often called the “Buffett Indicator.” It simply measures the total market capitalization of stocks vs. GDP.
The Wilshire 5000 is used as the broadest measure. In this case, reducing the number of shares outstanding does not directly affect total market value. But when stock buybacks do accelerate price/earnings ratios from higher EPS growth, then that does tend to raise the overall market capitalization to some degree. But this is still a better indicator than P/E ratios.
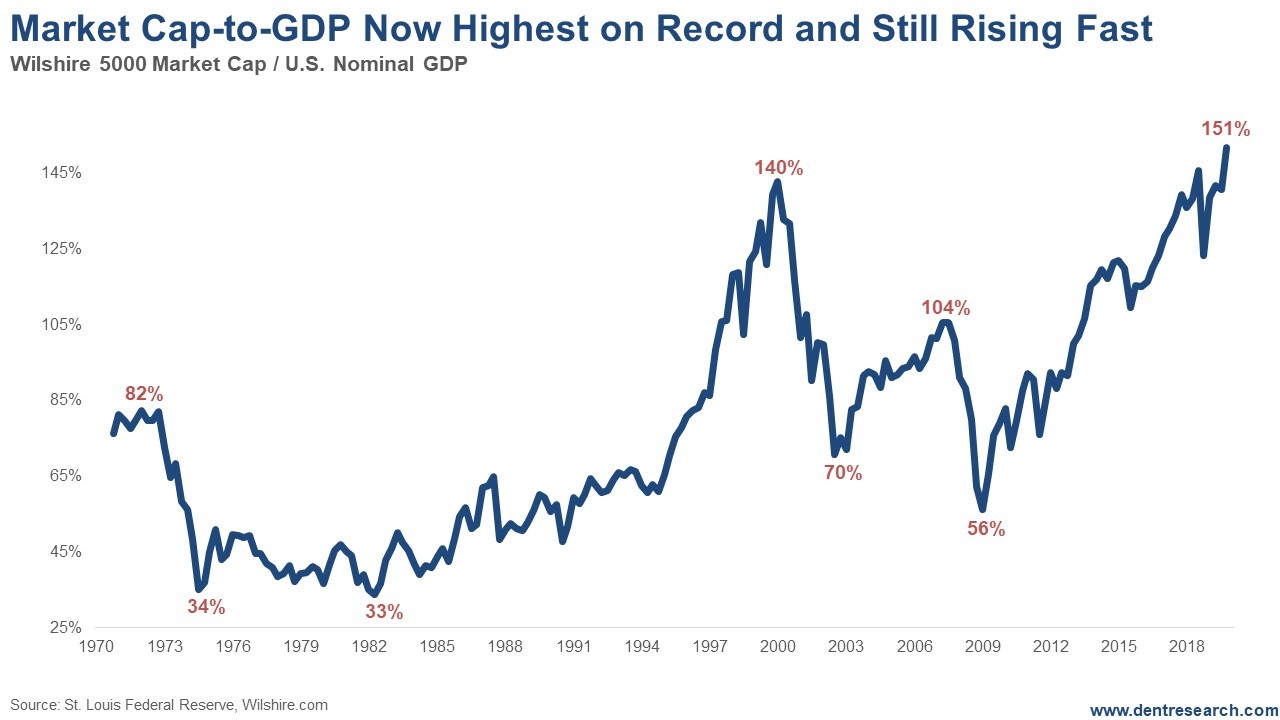
This indicator now at 151% and rising fast is clearly higher than the last all-time high at 141% in 2000, at the top of the last tech bubble peak. Hence, this tech-driven bubble has not gotten bubblier. And this indicator looks to go a good bit higher if my minimum targets for the Nasdaq of 10,000 are hit in the next few months.
This could hit 160%+ easy. And note how low this indicator got after the last tech crash – down to 56%. The real target on longer-term cycles would be down more to the 33% low in the early 1980s… One bad-ass crash coming, in that case.
The next less profit and EPS-oriented indicator is simply the S&P 500 Price to Sales Index. This again cannot be rigged by earnings manipulation, although stock prices will lean higher due to stock buybacks leading to higher valuations overall. This indicator is also at new highs, a bit higher than the 2000 bubble top.
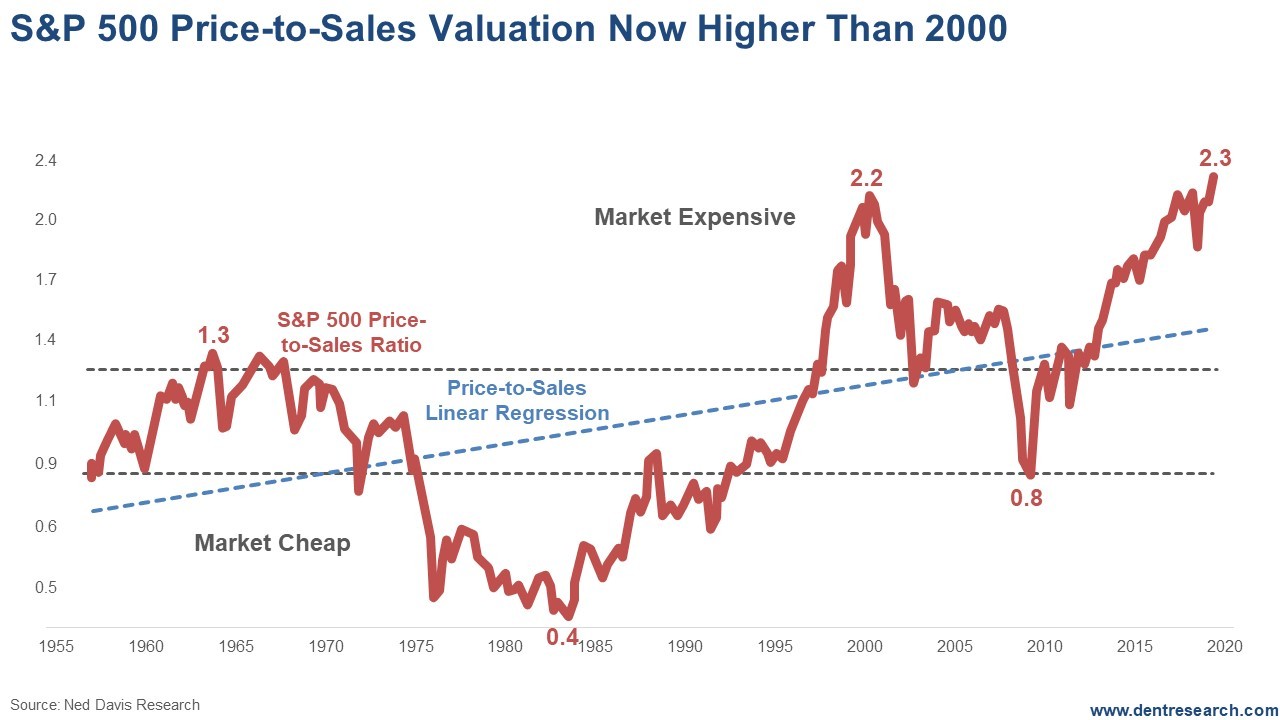
On this chart, the trendline regression is helpful. Stocks at 2.3 are not quite as high above that trend line as they were in early 2000. They would be at about 2.45, not that much higher and something that could be hit in early 2020 if this rally continues with the massive unprecedented repo infusion (now over $500 billion in 3 months), which I will write about in the next week. Using the regression line, I would forecast that this indicator falls to about 0.4-0.5 by 2022 or so… much more than the prior two crashes.
This market does not look like it wants to peak yet. But the burst will be monumental when it finally does…
If anyone tells you the market isn’t that overvalued… just give them a little slap and keep walking.
Author

Harry S. Dent, MBA
Dent Research
Harry S. Dent Jr. studied economics in college in the ’70s, but found it vague and inconclusive. He became so disillusioned by the state of his chosen profession that he turned his back on it.


