The Gold Market in 2017

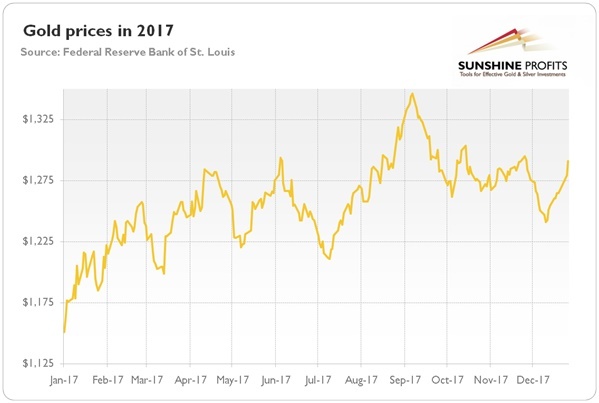
So another year has passed. How quickly it happened! But we hope that you did not get bored, and instead took time to learn more about the fascinating gold market. At first glance, 2017 seems to be a dull period for the yellow metal, as it was traded within a narrow range of $1,200-$1,300 for most of the year.
However, all that glitters is not gold, and all that does not fluctuate like Bitcoin is not uninteresting. Actually, the price of bullion gained more than 12 percent, as one can see in the chart below.
Chart 1: Gold prices (London P.M. Fix) over the last twelve months.
Surely, compared to Bitcoin’s enormous rally it is a humble performance. But we can look at this from another point of view. Gold prices rose despite the competition from the cryptocurrencies. And they increased despite, also, the Fed’s tightening cycle, subdued inflation, tightening labor markets, the stock market boom and accelerating global growth. Hence, gold’s performance is actually quite impressive given the unfavorable macroeconomic environment.
Moreover, gold gained slightly more than in 2016. And all 2017’s lows were higher than the bottoms formed in December 2016. It looks encouraging, but, on the other hand, gold failed to escape the $1,300 ceiling in a sustained manner.
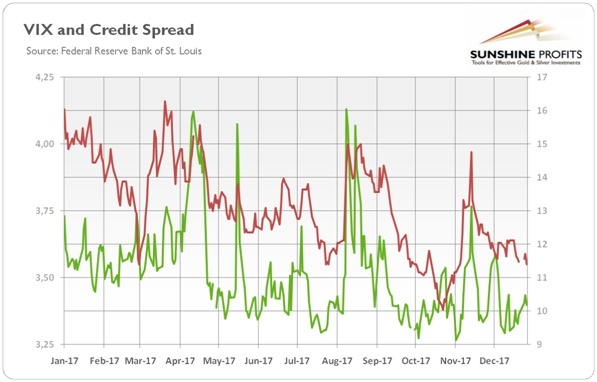
As in the previous year, the first two months of 2017 were excellent for gold as the shiny metal found a bottom of only $1,132 after the FOMC meeting in December and the second interest rate hike since the Great Recession. From then, the shiny metal has been in an upward trend (although with some ups and down on the way due to the uncertainty about the North Korea, changing prospects of the U.S. tax reform or the French presidential elections, and the actions of the Fed and the ECB), reaching a peak at $1,346 in early September in the aftermath of the sixth North Korean nuclear test. Since then, the shiny metal has been in a downward trend triggered by the rebound in the risk appetite among investors (see the chart below) and in the U.S. dollar index, confirming the impact of the greenback’s value on the price of gold and the latter’s role as a safe-haven asset.
Chart 2: The CBOE Volatily Index (green line, right axis) and BofA Merrill Lynch US High Yield Option-Adjusted Spread (red line, left axis) in 2017.
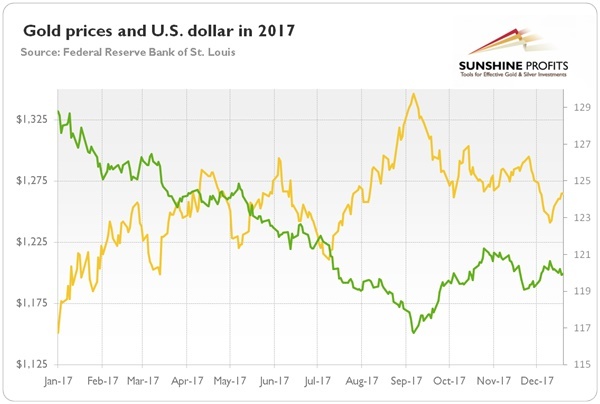
Indeed, in the last year, the U.S. dollar was again one of the main drivers of the gold prices, as the next chart shows. The presented lines – the price of gold and the U.S. dollar index – clearly look like mirror reflections of each other.
Chart 3: Gold prices (London P.M. Fix, yellow line, left axis) and the Trade Weighted Broad U.S. Dollar Index (green line, right axis) over the last twelve months.
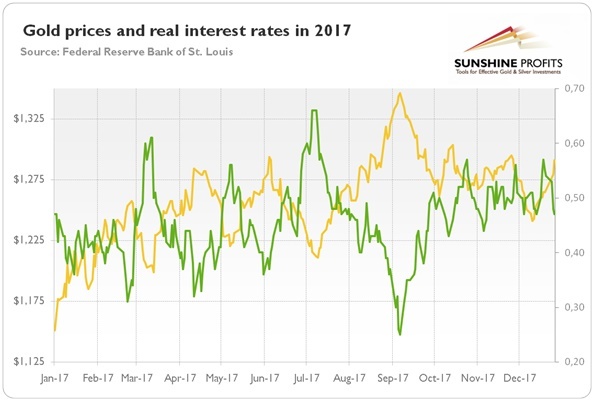
Another significant driver of the price of gold were the real interest rates. The next chart shows the strong negative correlation which existed in 2017 between them and the gold prices. However, the U.S. dollar influence was much higher – the correlation coefficient was almost -0.84, while for real interest rates it was “merely” -0.52.
Chart 4: The price of gold (yellow line, left axis, London P.M. Fix) and the U.S. real interest rates (green line, right axis, yields on 10-year Treasury Inflation-Indexed Security) in 2017.
To sum up, the price of gold rose by more than 10 percent in 2017. It means that it performed slightly better than last year. But the real difference is that in 2016, gold prices did not rally despite many potential catalysts (such as the Brexit vote or the Trump victory), while in 2017, the price of gold did not fall despite many potential blows (such as the three Fed hikes, the strong momentum in economic growth on both sides of the Atlantic, the U.S. tax reform, further gains in the stock market, or the exponential rise of Bitcoin prices). The price of gold did not rise linearly – we can distinguish a bull market until September and bear market since then due to the return of the risk appetite and the rebound in the U.S. dollar.
Will this trend continue in 2018? Well, the geopolitical uncertainty and the revival of the Eurozone (and, thus, the euro against the greenback) may support gold prices. On the other hand, strong economic momentum could make gold struggle in 2018. The Fed expects three interest rates hikes in 2018, while the markets see only two – we believe that there is more potential for hawkish surprise, especially given a new composition of the FOMC and the possibility of increased infrastructure spending in the U.S. Inflation should rise, but rather moderately. And given the declines in 2017 and the interest rates divergence between the U.S. and other major economies, we believe that the potential for further declines in the greenback is limited. Hence, we are neutral to slightly bearish for the gold market in 2018.In the short run, gold price may be under downward pressure because of the impact of tax reform and improved sentiment towards the Trump administration and the U.S. economy, while in the long-run the capital spending should lead to rising wages and inflation expectations, pushing gold prices up. We would be more bearish, but we acknowledge that the U.S. dollar may continue its decline for a while regardless of its medium-term trend (we will dig into the outlook for the greenback in 2018 in the last part of this edition of the Market Overview). One thing is certain: gold’s trading activity has been unusually calm in 2017, though it may finally change.
Want free follow-ups to the above article and details not available to 99%+ investors? Sign up to our free newsletter today!
Author

Arkadiusz Sieroń
Sunshine Profits
Arkadiusz Sieroń received his Ph.D. in economics in 2016 (his doctoral thesis was about Cantillon effects), and has been an assistant professor at the Institute of Economic Sciences at the University of Wrocław since 2017.


