The Full Moon and Mercury Top The S&P

Chaos Clinic for 9/4/2020
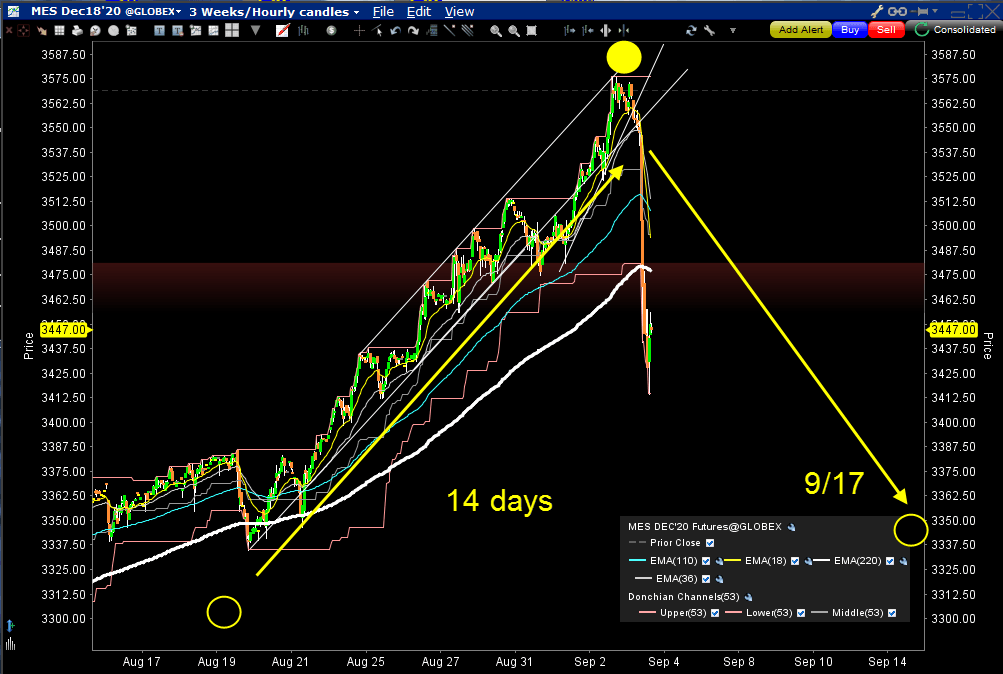
In the last two weeks, the S&P 500 rallied sharply. Then today (Thursday, September 3rd) it dropped sharply, after rallying sharply yesterday. This chart shows what happened.
The rally was basically from the late August New Moon to this week's Full Moon. The rally 14 days, half a Moon cycle. The last portion rallied very sharply, in a move that took 45 hours (one-eighth of a 360-hour circle = 15 days. ) This was clearly a blow-off type move.
Then today the bottom fell out. This sharp drop was in part caused by a synchronization of the Full/New Moon cycle with the Moon-Mercury cycle of 40 days. This cycle is recorded many times in the Bible - Christ in the desert, Noah's flood, Moses on the Mountain, etc. The cycle is mentioned in over 100 bible verses. It shows up in wheat prices as far back as Babylonian times.
When cycles synchronize, they form another cycle known as a beat cycle. The 40-day Mercury-Moon cycle and the 29.5 day Full Moon cycle form a 112.38 day beat cycle. This turns out to be almost exactly one half a 224.70 day Venus cycle and nearly equal to the 115.87 day Mercury-Earth cycle. So right now, the planetary energy cycle is ringing like a bell, forming a resonant energy peak.
Physically, the Full Moon reflects negative ions from the solar wind back into our atmosphere, making humans feel giddy and romantic. The New Moon moves between the Sun and the Earth, trapping those ions, making humans feel down. That's why since ancient times, armies have attacked their enemies at New Moon, when they were emotionally down, after whipping their own warriors into a frenzy to overcome the negative effect. Just based on the Moon cycle, prices may well decline into the next New Moon September 17th.
The chart shows a Rainbow of EXMAs. The numbers 18, 110, and 220 come from the EXMAs used on daytradingforecasts.com where the values are in minutes. Here the values are in hours. Today's drop broke vertically down through the 220 hour EXMA, turning it sharply down. A vertical drop through an EXMA usually signals a significant change in trend that will be down for at least the length of the EXMA, in this case, about 9 days.
So it could well be that the S&P has ended its COVID-19 "recovery bounce." As the election race heats up, it adds uncertainty to an already uncertain situation. The markets do not like uncertainty. The 60 days until the election are 1.5 the Mercury Moon cycles. The longer cycles mentioned above could extend the decline.
This content was published on Dr. Al Larson's Chaos Clinic which you can attend each Friday for free.
Dr. Al Larson has developed a complete Chaos Model of Markets, four unique courses that let you become a Certified Chaos Trader, some very unique eMylar fractal pattern overlays, and tools that permit forecasting individual stocks and markets years in advance. You can also sign up for a free weekly email, and attend a free Chaos Clinic on Fridays. To learn more, click on the author's profile.
Be sure to sign up for the free weekly email!
Author

Dr. Al Larson, PhD
MoneyTide.com
Dr. Al Larson holds a Ph.D. in Electrical and Computer Engineering from the University of Wisconsin. He is a 1964 Distinguished Graduate of the U. S. Air Force Academy.