The doom and gloom of precious metals: Silver under siege
If you are wondering why Silver collapsed after central banks’ announcements, there’s just one word that can easily answer that question: returns.
Market participants are not there for the sake of prices, but for their own sake. And the latest developments clearly indicate that holding precious metals could be a safe option, but not the best one.
It’s all about the war
The Iran war was the catalyst for an unexpected new macroeconomic frame that twisted policymakers’ hands worldwide. Most major central banks announced their monetary policy decisions this week, and all coincide to hold their monetary policies unchanged amid a new wave of uncertainty.
The Fed has not only refrained from cutting rates but also warned about resurgent inflation ahead. The same goes for every other central bank that met this week. Risk points to higher inflationary pressures and lower growth. Cutting interest rates is being buried in the shadows, and rate hikes are back on the table.
U-turn to the hawkish side
So, why is it that central banks’ U-turn to the hawkish side resulted in plummeting Silver?
The answer is simple: financial markets are anticipating higher interest rates, which usually boost government bond yields while pushing bond prices lower. Silver, on the other hand, offers no yield. So, if you want to safeguard your savings, which one would you choose? The cheaper one that offers a yield, or the expensive one that gives nothing in return? What we are seeing these days is speculative interest rushing away from its Silver holdings and moving into more amicable government bonds.
In the United States, the yield on the 10-year Treasury bond is currently at around 4.28%, flirting with 2026 highs. It’s not a coincidence; it's central banks.
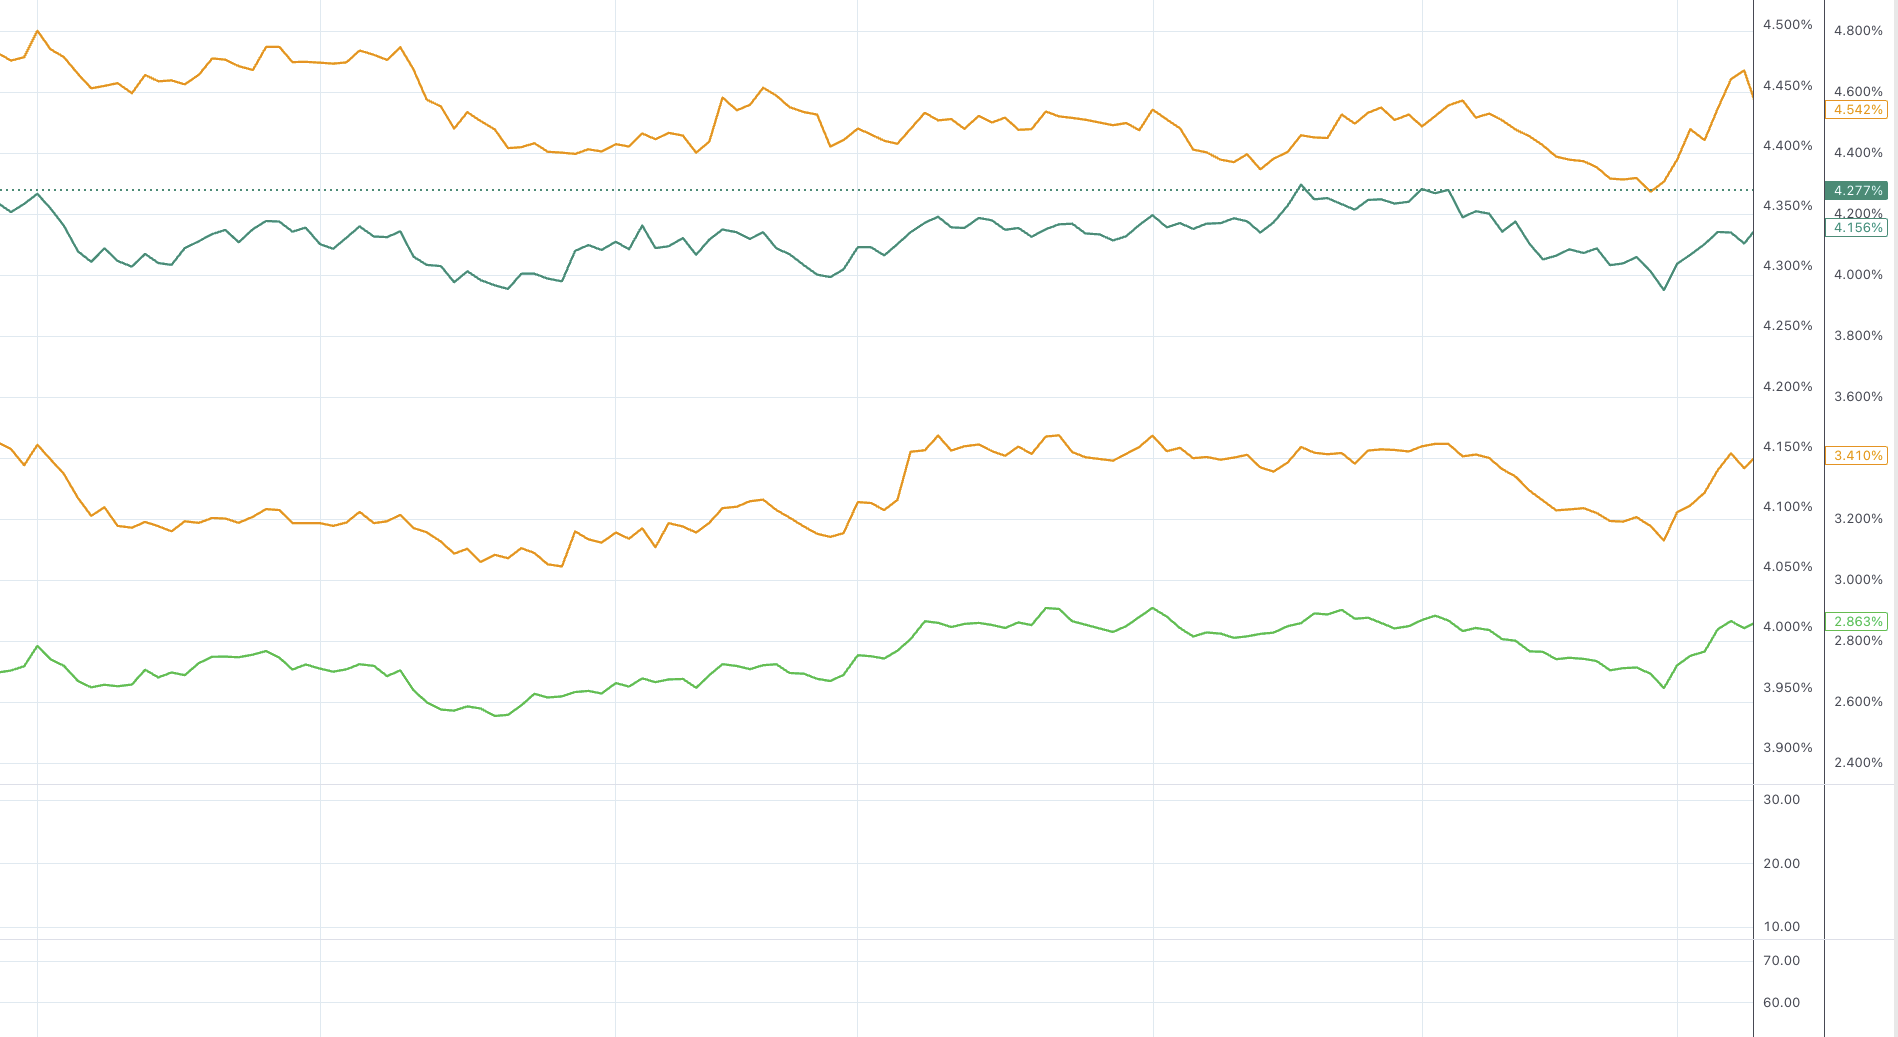
Daily evolution of UK, US, Canada, and German (up-down) 10-year government bond yields - Source: Trading view
‘Anchored’ lower lows for Silver
There are additional factors that suggest Silver will continue its downward trend: a strengthening US Dollar. The United States has become the largest oil producer in the world, and, as US President Donald Trump claims, higher oil prices will redound to higher export earnings. Also, the latest Federal Reserve Summary of Economic Projections showed that officials upwardly revised their growth forecast. There is no doubt that the US, regardless of Trump’s ideas, is the world’s largest economy.
There is little out there suggesting American growth will suffer a setback. On the contrary, even policymakers expect economic progress to continue in such a chaotic time.
XAG/USD trades around $70 after nearing the critical $64 support area
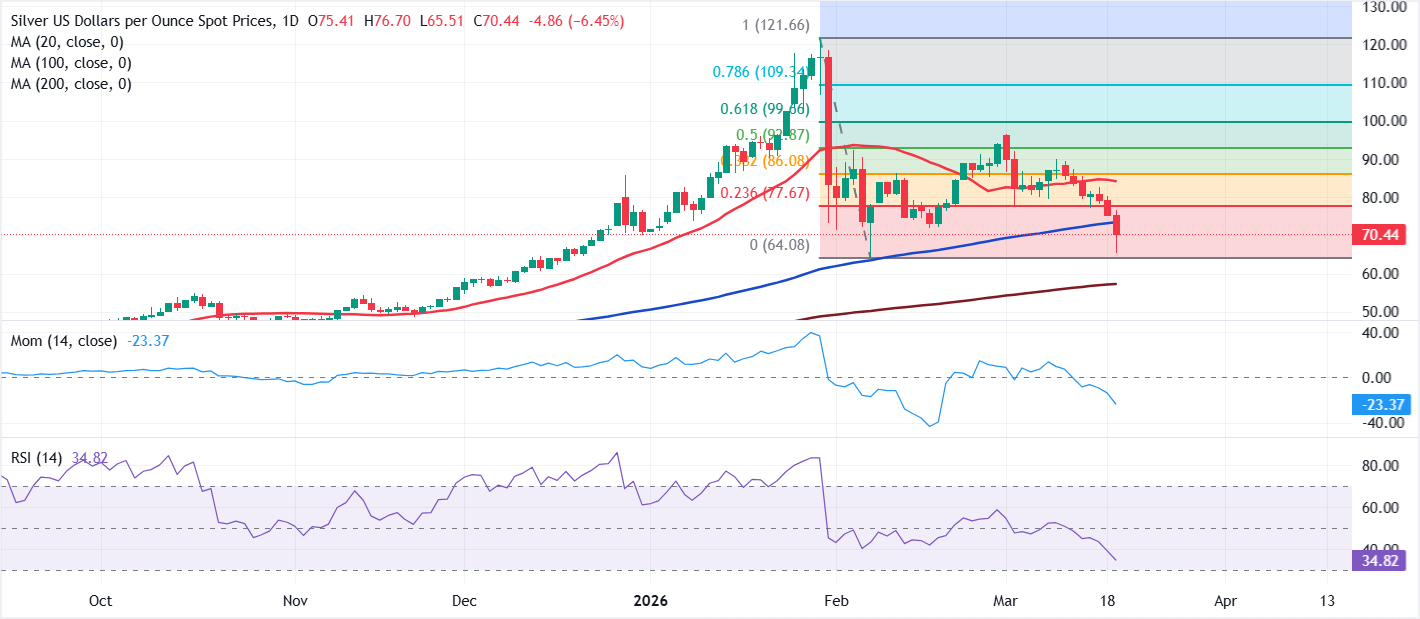
The XAG/USD pair traded as low as $65.50 after all major central banks were done and dusted, then bounced a bit and stabilized around $70. At this point, the pair has pretty much completed a full 100% retracement of the latest daily slump between $121.66 - $64.08. The base of the range remains intact, but the price is ready to challenge it.
Technical readings in the daily chart support the bearish case, as XAG/USD is trading below its 100-day Simple Moving Average (SMA) for the first time since March 2025. The SMA now provides resistance at around $73.20 ahead of the immediate Fibonacci resistance, the 23.6% retracement at $77.67. Meanwhile, technical indicators aim firmly south within negative levels, reflecting sellers' strength and hinting at additional slumps ahead.
Once $64 gives up, XAG/USD sellers will aim for $59.00, where Silver has a congestion zone from December 2025. Additional slides should expose the 200-day SMA, now hovering around $57. The 200-day is now a line in the sand; a clear break below it should open the door for a long-term, continued slump.
Author

Valeria Bednarik
FXStreet
Valeria Bednarik was born and lives in Buenos Aires, Argentina. Her passion for math and numbers pushed her into studying economics in her younger years.















