The DeCarley Perspective: Futures market heat check
Futures market heat check
Being a futures broker is nothing like the depiction of the industry in Trading Places (a 1983 film starring Eddie Murphy and Dan Aykroyd). Most brokers, and brokerage industry employees, aren’t wearing fancy suits or arriving to work in limos. We aren’t enjoying chef-prepared meals at a fancy oak dining table while we casually go over the day’s market movements. Instead, it is an industry full of grunt work, grit, and gut checks. Many of us eat two meals a day at our desks while scrambling to try to help clients avoid catastrophe; it is far from glamorous. The commodity brokerage industry delivers the highest of highs and the lowest of lows; you can’t get to the former without suffering through the latter.
For me, 2022 has felt a lot like a repeat of the financial crisis. The era created wealth for those that play outside of the probabilities but proved to be painfully dire for those who operate in favor of the odds. Although the equity market, thus far, has managed to avoid the same fate as the 2008/2009 bear, the intense volatility and despair in peripheral assets such as currencies and Treasuries have been far more challenging.
During the financial crisis, the culprit was credit default swaps and bank leverage. This time around, the leverage risk in the system was introduced by the Fed (keeping rates too low for too long and the purchase of Mortgage Backed Securities beyond reason) and politicians (too much stimulus). The credit default swaps of 2022 are ETFs, in my opinion. Leveraged ETFs, and those backed by commodity futures, have added an element of volatility that was unfathomable before the retail trading boom and the creation of products to cater to the demographic of new traders. Leveraged and commodity ETFs are packaged products sold to retail traders to mimic leveraged products (such as futures contracts) or to mimic a particular commodity. In both cases, they require constant rebalancing and dealing with retail trader cash inflows and outflows that the futures markets aren’t always capable of absorbing in a civilized manner. This process is further exacerbated by algorithmic trading that piles into trends pushing them further and farther than would otherwise be the case. Of course, humans themselves are erratic and have been known to cause unnecessary volatility as they react emotionally to price changes, but the 2022 volatility is different from the 2008/2009 volatility. This is the new normal, and we’ll need to adapt.
Let’s take a look at some of the key markets that have contributed to the chaos we are seeing in markets today.
Commodity prices
The commodity boom and bust of 2021/2022 started with copper, lumber, and natural gas. These were the stories that inflation hawks were pointing out. Each of these commodities rallied sharply in 2021 causing disruptions in manufacturing and home building (copper and lumber) and increasing input costs for households, farmers, and service businesses (natural gas). The world watched in awe as prices of these commodities, and eventually others, skyrocketed, but they aren’t garnering the same amount of fanfare as they dribble lower. Inflation at the consumer level is still elevated but the primary contributors to that inflation are trading as if the narrative is one of deflation. This could be a sign that the Fed and the nature of commodity markets (high prices cure high prices) are working as planned.
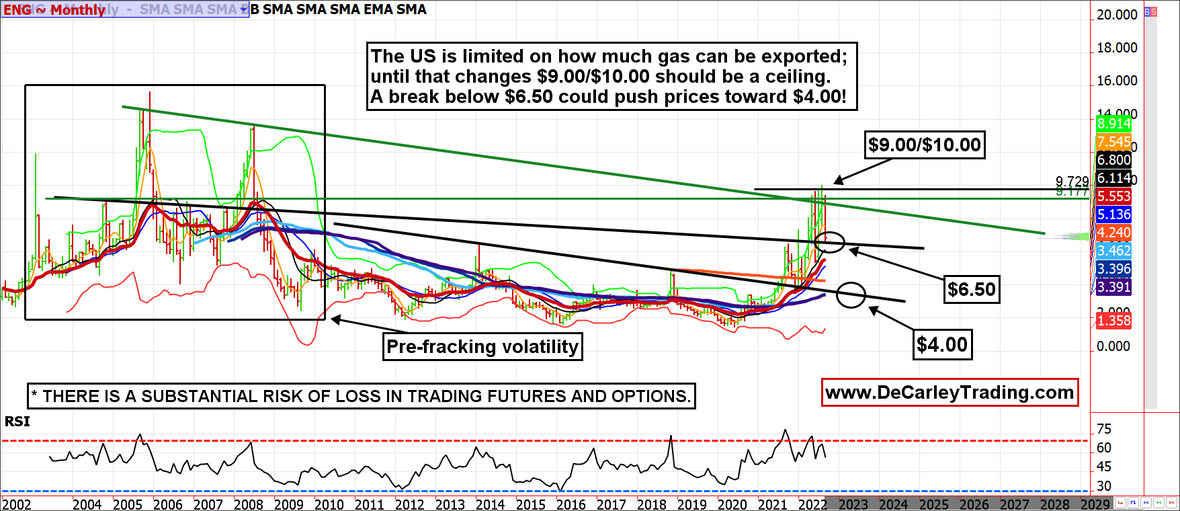
Some might not be aware, but lumber futures have eliminated the entire post-Covid rally and copper is at levels not seen since 2020. Natural gas has managed to stay afloat due to geopolitical issues in Europe, but in recent sessions, gas has fallen roughly 35% and according to the monthly chart, the market is in danger of breaking below critical support at $6.50. If this occurs, a meltdown toward $4.00 is a real possibility.
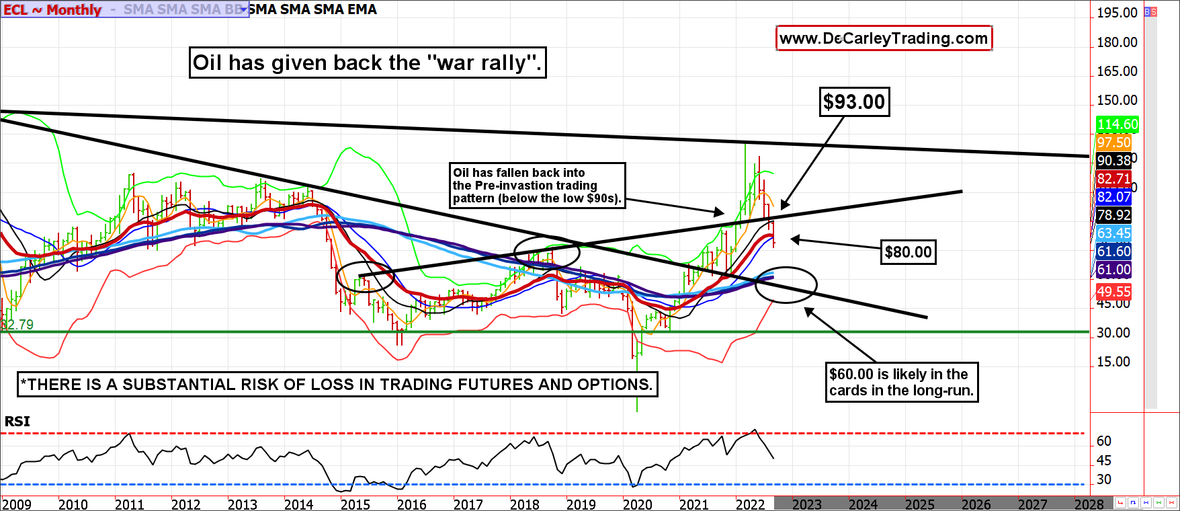
Oil futures are about $55.00 off their 2022 peak. In our opinion, oil at $130 per barrel was the mirror image of the oil collapse under $10.00 in the spring of 2020. Such prices are unsustainable and likely exacerbated by commodity ETFs (in our opinion, these products are a detriment to price discovery and breed chaos). In commodities, anything is possible, nevertheless, the pendulum swings hard both ways. Although most speculators have liquidated their long oil positions leaving room for a temporary reprieve in selling, the long-term prognosis for oil is a $60.00 print.
Inflation casualties
The primary casualties of inflation have been Treasuries, precious metals, and any currency that isn’t the US dollar. If market participants begin to react to lower commodities with the same conviction they reacted to higher commodities, the mean reversion will be stunning. Early in 2022, there were obvious and vicious cycles of buying commodities and selling Treasuries but we haven’t seen that work in reverse as oil and natural gas work their way lower.
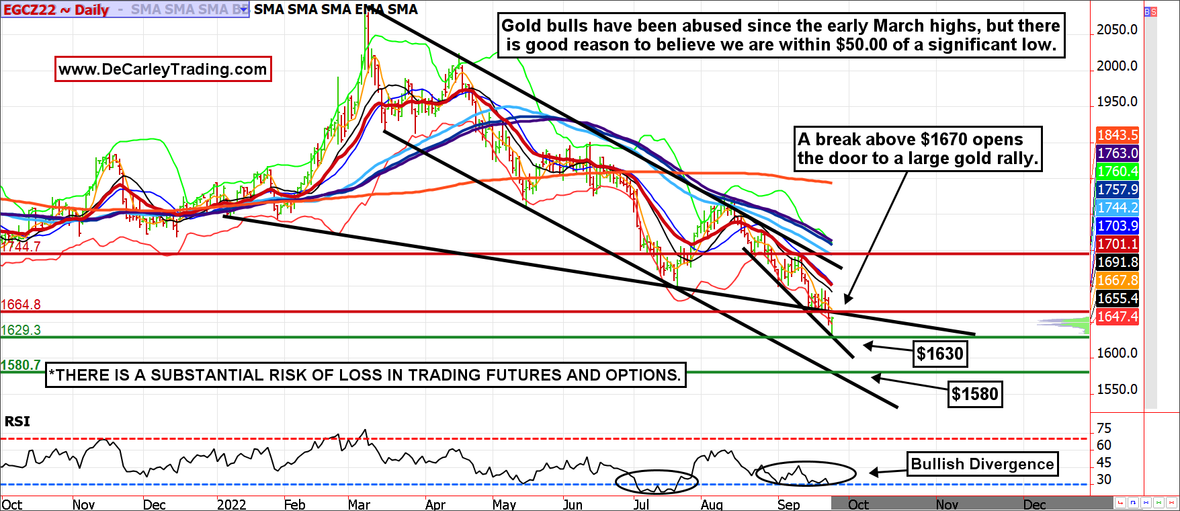
In the case of gold, higher interest rates and a nearly parabolic dollar rally, brought about by rampant inflation and the Federal Reserve’s reaction to it, have forced speculators to liquidate the majority of their long holdings. Throughout history, speculators have tended to be perpetually long gold; they are rarely net short in the gold market. However, when that long position has dwindled toward being net flat gold, we have seen sharp rallies as speculators get back into the market. From where we are sitting, that inflection point might be near.
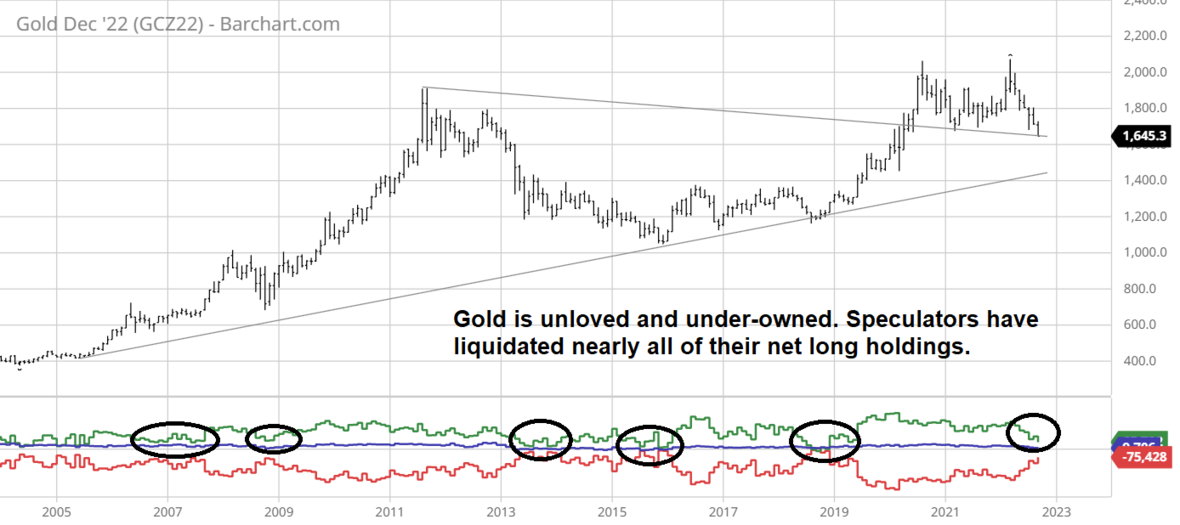
The pain in the gold tape is palpable, but the bulls have two potential reversal levels to keep an eye on: $1630 and $1580. While we would prefer not to see the latter, we cannot rule it out. If it occurred, it would likely be a quick probe lower to blow out week hands and sell stops. In any case, perhaps somewhere between $1630 and $1580, will eventually be looked back at as the last chance to get a ticket to the party.
While inflation and interest rates are the stories of the year, it is the results of those two factors on the US dollar that is dominating global markets at the moment. Last month we posted this chart with the thought that the US dollar could be putting in a double top for forging one last hurrah rally to the 113.40ish area.
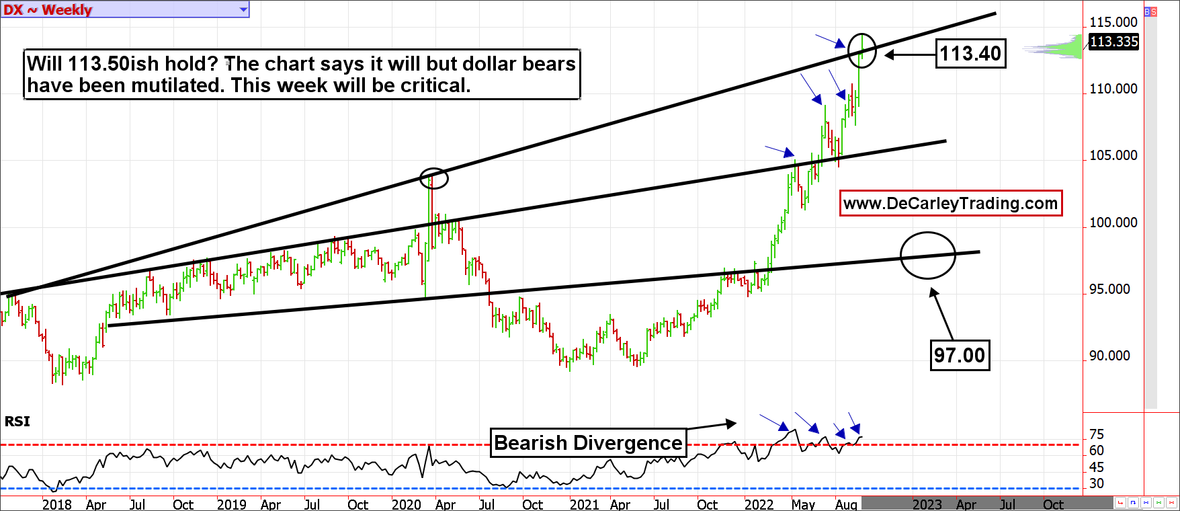
We were wrong about the double top, but we stand by the idea that weekly trendline resistance will hold the first time up, and maybe for several years to come. A weekly close below 113.40 would be confirmation of a reversal, but a weekly close above 113.40 suggests we are on to the next stop (the all-time highs near 120.00). I think we can all agree, this is undesirable and would be dire for the global financial system.
Conclusion
Keep an eye on the US dollar and the grain markets (corn, soybeans, and wheat). Food prices and currency market extremes are the last holdouts to refuse to succumb to gravity. If they finally give up the ghost, normalization of the bond market will be next, followed, eventually, by equities. That said, even if this view proves to be accurate doesn’t mean trading it will be a picnic. Volatility will be fierce, and traders will get run over as the markets shift narratives. Be careful out there.
*There is substantial risk of loss in trading futures and options. There are no guarantees in speculation; most people lose money trading commodities. Past performance is not indicative of future results.
Seasonality is already factored into current prices, any references to such does not indicate future market action.
**There is substantial risk of loss in trading futures and options.** These recommendations are a solicitation for entering into derivatives transactions. All known news and events have already been factored into the price of the underlying derivatives discussed. From time to time persons affiliated with Zaner, or its associated companies, may have positions in recommended and other derivatives. Past performance is not indicative of future results. The information and data in this report were obtained from sources considered reliable. Their accuracy or completeness is not guaranteed. Any decision to purchase or sell as a result of the opinions expressed in this report will be the full responsibility of the person authorizing such transaction. Seasonal tendencies are a composite of some of the more consistent commodity futures seasonals that have occurred over the past 15 or more years. There are usually underlying, fundamental circumstances that occur annually that tend to cause the futures markets to react in similar directional manner during a certain calendar year. While seasonal trends may potentially impact supply and demand in certain commodities, seasonal aspects of supply and demand have been factored into futures & options market pricing. Even if a seasonal tendency occurs in the future, it may not result in a profitable transaction as fees and the timing of the entry and liquidation may impact on the results. No representation is being made that any account has in the past, or will in the future, achieve profits using these recommendations. No representation is being made that price patterns will recur in the future.
Author

Carley Garner
DeCarley Trading
Carley Garner is an experienced commodity broker with DeCarley Trading, a division of Zaner, in Las Vegas, Nevada. She is also the author of multiple books including, “Higher Probability Commodity Trading” and “A Trader's First Book on Commodities”.


